Commodity indicator hits the 2nd highest daily overbought reading in history
March 9, 2014
On March 6, 2014 a commodity indicator reached the 2nd highest daily reading in its history. This research report will take a look at the indicator in detail and see how this affects selected commodities and precious metal stocks.
The indicator is the $CCI RSI(24). The $CCI is a commodity index whose daily data starts in 1985. The RSI this research report analyzes is a daily RSI. Therefore, this study covers a time period which dates back to 1985.
The only day the $CCI RSI(24) was higher than it was on March 6 was on March 3, 2008. Commodities went up 0.62% to their intraday high two days later and then went down 12.83% in only 15 days.
Here are the top six daily readings:
| 2008 |
March 3 |
81.02 |
| 2014 |
March 6 |
80.62 |
| 2008 |
February 26 |
79.96 |
| 2008 |
February 28 |
79.92 |
| 2014 |
March 5 |
79.30 |
| 2005 |
March 11 |
78.95 |
Now here are the indicator highs of the year for the top 9 years:
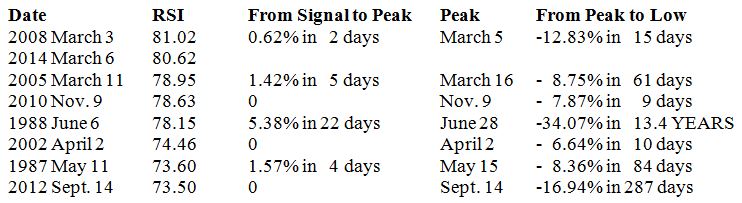
As you can see commodities topped within 5 calendar days of the signal peak in six of the seven prior instances. While it took another 22 days for commodities to top in 1988, commodities did not reach their June 28, 1988 highs again until 2004.
From December 8 to February 9, Absolute Value Research published quite a few bullish research reports on commodities. While this indicator suggests commodities in general are supposed to have a pullback, does this indicator work on corn, coffee, copper, heating oil, silver, precious metal stocks and wheat?
The current reading is the second highest annual reading in history in between 2008 and 2005. Let’s see how the various commodities fared after the 2005 and 2008 signals. Since we haven’t hit the #1 reading of all-time in 2008 (March 3), in an effort to be conservative, let’s use the next highest reading in 2008 (February 26).
The drawdowns after the dates are from the signal, not from the price high. So, once again, this is a conservative way of looking at the indicator.
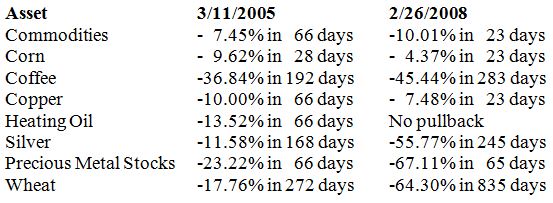
Corn
3/11/2005 -9.62% over the next 28 days
2/26/2008 -4.37% over the next 23 days
The minor peaks were
3/15/ 2005 (within 4 days of the signal)
3/11/ 2008 (within 14 days of the signal)
This indicator in isolation suggests corn is due for a March pullback. However, after the pullback corn should go to higher highs.
If you click on “Indicator suggests corn set to have aMAIZEing returns ” you will note the November 18 signal was ranked #2 between the September 14, 2009 and July 8, 1997 signals. Corn’s initial rally from the 2009 low lasted 122 days. The price of corn then dropped 22%. The 1997 rally lasted only 107 days. An initial thrust similar in duration to those two rallies would suggest a top somewhere between March 5 and March 20.
Coffee
3/11/2005 -36.84% over the next 192 days
2/26/2008 -45.44% over the next 283 days
Coffee’s high in 2005 was on the exact day of the March 11 signal. In 2008, coffee’s high was on February 29 which was three days after the February 26 signal. Coffee has had a nice run. It has more than doubled since the November 14 signal Absolute Value Research wrote about in “Coffee indicator at levels which has always led to 517% returns”. Back then AVR wrote “If you look closely at the chart, you will notice that after every big oversold reading, coffee rallies for a few months, then has a correction or a bear market.”
Copper
3/11/2005 -10.00% over the next 66 days
2/26/2008 - 7.48% over the next 23 days
If you read “Copper indicator hitting all-time low suggests copper will hit an all-time high ” you will note there were two prior signals (in 2001 and 2009). The rally off the copper low in 2001 had some backing and filling for months. The 2009 rally went straight up. The 2013-2014 move more closely resembles 2001 than 2009.
Heating Oil
3/11/2005 -13.52% over the next 66 days
2/26/2008 No pullback until the July high
Heating oil kept on going up for a few months after the 2008 signals. Therefore, it is not appropriate to use this indicator for heating oil.
Silver
3/11/2005 -11.58% over the next 168 days
2/26/2008 -55.77% over the next 245 days
The high for the first nine months of 2005 was on March 9 (within two days of the signal).
The 2008 high for silver was on March 17 (within 20 days of the signal).
While evidence suggests silver will eventually go considerably higher, if commodities have a 7% to 12% pullback, silver will probably fall in sympathy. Silver was very oversold in late 2001. Silver’s low of the last decade was on November 23, 2001 at $4.05. However, on October 11, 2002 (a full 10.5 months later), silver was only trading at $4.24 which is a mere 4.6% above the low. Silver bottomed on June 27, 2013 at $18.21. If a similar situation would play out, silver would trade at $19.04 on May 15. Despite the inauspicious beginning, silver went up 1,129% from the November 23, 2001 low in less than 10 years. This is not a prediction. The point is that sometimes indicators can take a long time to play out.
Precious Metal stocks
3/11/2005 -23.22% over the next 66 days
2/26/2008 -67.11% over the next 241 days
The high for the first 8 months of 2005 was on March 9 (within two days of the signal).
The 2008 high was on March 14 (within 17 days of the signal).
This is telling a similar tale to last week’s research report on gold stocks.
Wheat
3/11/2005 -17.76% over the next 272 days
2/26/2008 -64.3% over the next 835 days
Wheat’s high in 2005 was on March 15 (within 4 days of the signal).
Wheat’s all-time high was on February 27, 2008 (within 1 day of the signal).
Wheat hit a 3.5 year low on January 29. Four days later (two of which were Saturday and Sunday) Absolute Value Research wrote a research report on wheat. Some backing and filling at this point would not be surprising.
The following table lists the drawdowns from the signal date close (not the price high) to the subsequent price low.
Indicator: $CCI RSI(24)
Inception: January 2, 1985
Frequency: Daily
Indicator Percentile (March 6, 2014) 100.0% (ranked #2 out of 7,437) |