Obscure indicator hitting half century low suggests an 88% silver rally
January 19, 2012
From April 25, 2011 to June 27, 2013, silver declined by 63%. This downturn has been one of the greatest bear markets in silver history. To make things worse for the silver bulls, the stock market has been going through the roof. In fact, the relentless underperformance of silver relative to the S&P 500 has been historic. But that may be about to change. This research report will look at a silver indicator which hit the most extreme level in over half a century.
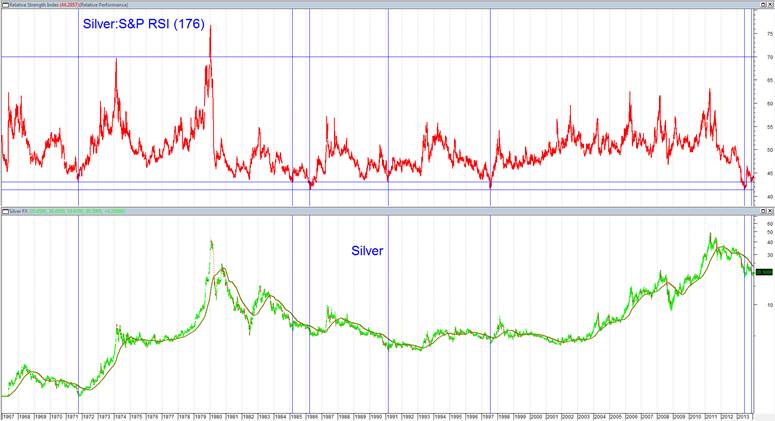
First let’s take a look at silver, the S&P and the ratio of silver to the S&P over the last 50 years.
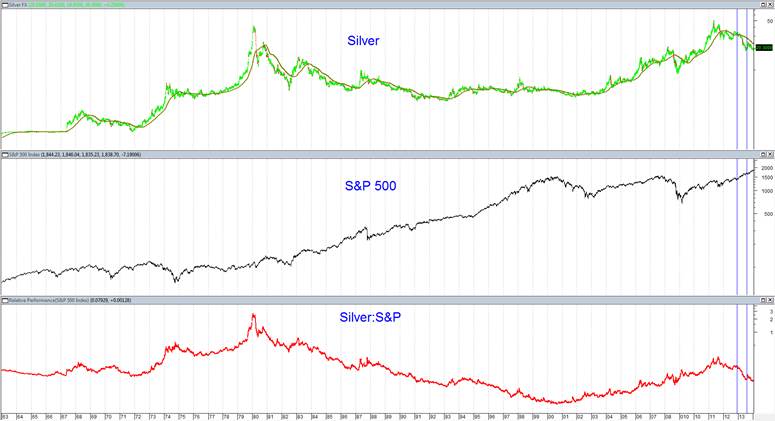
Silver and the S&P both experienced major highs in April 2011. For those curious as to what the quantitative indicators were saying on the exact day of silver’s multi-decade high, click here. The ratio of silver to the S&P (Silver:S&P) didn’t peak until August 22, 2011 because the S&P went down more than silver the first few months of their declines. Similarly, although silver bottomed in June 2013, Silver:S&P bottomed on December 31, 2013. The S&P went up a lot more than silver the last six months of 2013.
From November 26, 2012 to August 6, 2013 the underperformance of silver was particularly nasty. There are two vertical blue lines drawn on the chart on those dates. You can see silver went straight down and the S&P went straight up. What is the significance of this? This sort of activity often happens at the end of a move and marks capitulation.
Let’s look at a widely used quantitative indicator called the RSI. RSI stands for Relative Strength Index. The RSI is a misleading name because this indicator really calculates a security’s strength relative to itself over a period of X days. In charting software, the default number of trading days the RSI measures is 14. Why 14? The story goes that the inventor of the indicator backtested the indicator and figured that 14 was the optimal number of trading days for this indicator. The vast majority of articles which reference the RSI use the 14 default number. But it can be worth your while to take the trouble to change the default setting. As mentioned before, silver really underperformed the S&P from November 14, 2012 to August 6, 2013. That equates to 176 trading days. Let’s see what the Silver:S&P RSI(176) looks like:
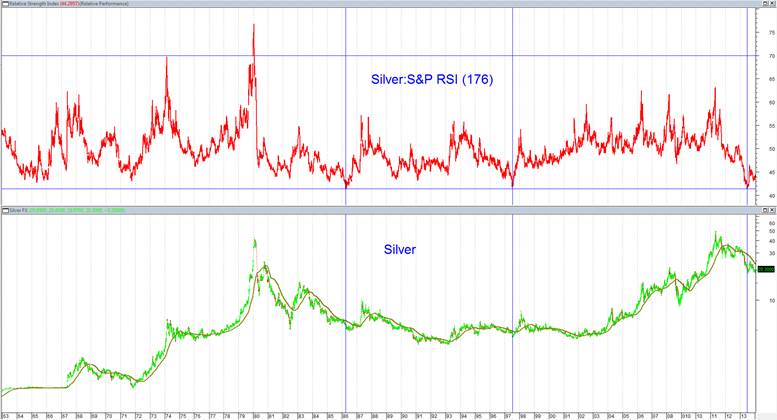
As you can see by the vertical blue lines on the chart, over the last half century, the Silver:S&P RSI (176) was near the June 27, 2013 price bottom level on three different occasions:
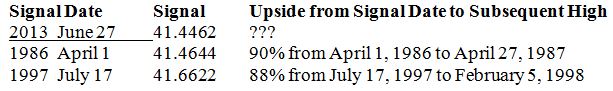
In the 1997 instance, silver went straight up for six and a half months. This was not the case in 1986 and 2013. On April Fool’s Day 1986, silver closed at $5.15. On December 26, 1986 it closed at $5.27. So for 8.8 months, silver went up only 2.3%. Then silver went up 85.9% in less than four months.
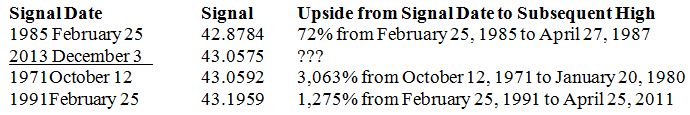
If you look at the Silver:S&P RSI (176) chart you can see that the indicator went up for a couple of months in both 1986 and 2013 and then pulled back. The RSI indicator was very low at the bottom of its second leg down in December. In fact, it got so low that it would be a pretty dramatic extreme for the indicator by itself . Since silver was “fixed” from 1963-1966, let’s throw out those years. Besides the aforementioned June 2013, 1986 and 1997 readings, since 1967 the only times the indicator was around the levels it was on December 3 were:
Here is the chart with all seven signals from both tables designated in vertical blue lines.
What about downside risk? As you can see by eyeballing the chart, with the exception of 1985, when the indicator got this low there wasn’t much downside left for silver at all. Here is how much silver went down from the signal date to the lows before the high:
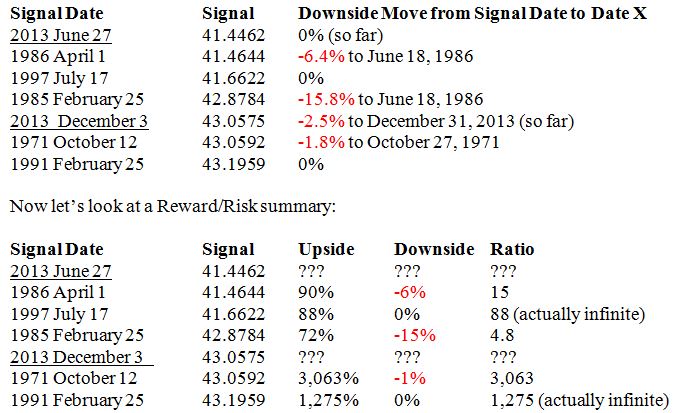
With the sole exception of the 1985 signal, the reward/risk ratios are extraordinarily high. The 1985 instance was the only time silver went down 7%. As for 1985…well that wasn’t exactly the end of the world either. If you bought silver on February 25, 1985 you made 72% in 2.2 years and suffered a relatively manageable 15% drawdown in between.
In summary, the Silver:S&P 500 RSI (176) is a great example of an indicator which has extremely high reward/risk characteristics. If history repeats, this is an excellent time to buy silver.
Indicator: Silver:S&P RSI (176)
Inception of Data: January 1, 1920
Inception of Study Period: January 1, 1962 and January 1, 1967
Frequency: Daily
June 27, 2013 Percentile (from July 1, 1962): 0%
|