Heating Oil Indicator Hitting All-Time High Suggests Heating Oil Will Hit All-time High
by James V. Debevec II
January 5, 2013
On November 12, 2013 in the U.S. Commodity Futures Trading Commission’s Commitments of Traders Report, the Heating Oil Commercials Net Position was 31,853 contracts. This was an all-time record. Anytime you hear of an indicator hitting an all-time record your ears should perk up because that means something highly unusual is going on. This article will explain this indicator in greater detail and see if it has predictive value.
The United States Government is a political unit which performs functions such as running the
U.S. Commodity Futures Trading Commission. The CFTC is the watchdog of the futures market. It also produces the
Commitment of Traders Report. The COT “provides a breakdown of each Tuesday’s open interest for markets” such as
Heating Oil which is a petroleum product used for fuel. The market participants who bet on the price direction of this commodity are divided into three groups. One of these three groups is called the
Commercials who often physically possess the underlying asset. Adding up all their futures long contracts and then subtracting from that number all their futures shorts contracts gives us their
Net Position which was 31,853 on November 12, 2013. A new record!
You can click here to go to the CFTC COT webpage. If you click on the links of a few of the many reports they list, you will quickly discover the CFTC presents the COT data in raw data form. Fortunately there are a number of companies/websites that transform the raw data into more user friendly material. The COT report covers many assets in commodities, foreign exchange, stocks and fixed income. Within each asset the market participants are divided into three big categories. Each category is further subdivided by longs, shorts and net.
Here is how the COT data looked on November 13, 2013:
Asset |
Category |
Longs |
Net |
Shorts |
Heating Oil |
Commercials |
191,296 |
|
|
Heating Oil |
Commercials |
|
31,853 |
|
Heating Oil |
Commercials |
|
|
159,443 |
Heating Oil |
Non-Commercials |
40,222 |
|
|
Heating Oil |
Non-Commercials |
|
(35,200) |
|
Heating Oil |
Non-Commercials |
|
|
75,422 |
Heating Oil |
Non-Reportable |
34,785 |
|
|
Heating Oil |
Non-Reportable |
|
3,347 |
|
Heating Oil |
Non-Reportable |
|
|
31,438 |
Heating Oil |
TOTAL |
266,303 |
- |
266,303 |
Just like the Copper COT report Absolute Value Research wrote about two weeks ago, the total longs=the total shorts and the total net = zero.
Basically what is going on here is the heating oil producers (commercials) are long and the hedge funds (non-commercials) are short. Who is going to win?
The following table lists the five highest yearly highs in the Commercials Net for Heating Oil:
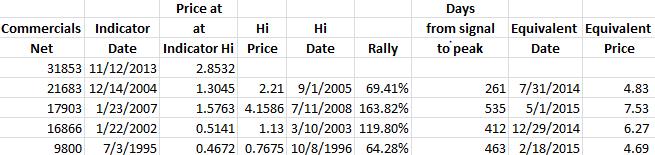
The blue vertical lines in the chart below match up with the Indicator Dates in the table so you can get the visual.
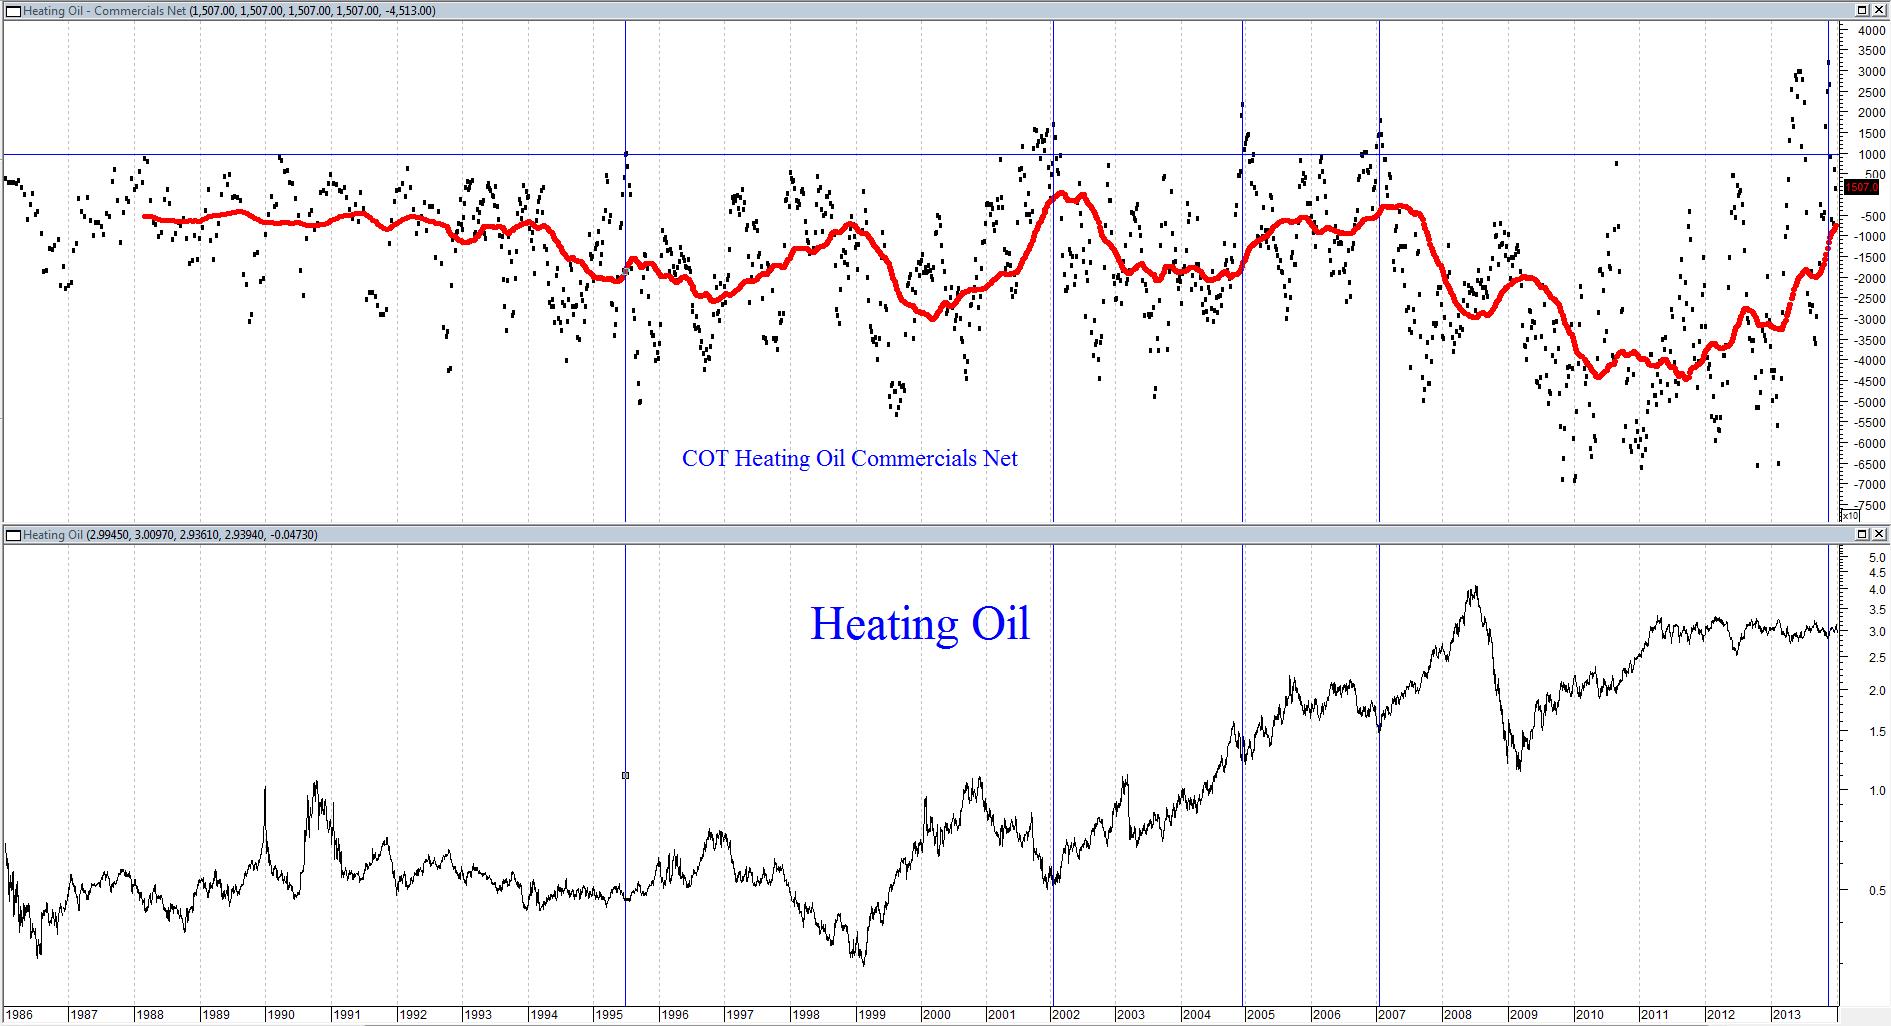
The top chart is the COT Heating Oil Commercials Net Position. If you zoom in the top chart, on the right side you will see an x10 multiplier in a box. So 3,000 on the top chart means 30,000 in real life. The bottom chart is the price of a gallon of heating oil (which is NOT x10).
Now you may have noticed that in June the commercials were extremely bullish and the subsequent rally has been rather modest. The high June reading doesn’t get a blue line because the November reading was even higher. But if you bought heating oil at that point you got a move up with very little downside. The pattern resembles the 1995 situation.
On March 14, 1995 the commercials were the most bullish in over three years and heating oil prices went up 13%. The commercials sold into the rally and heating oil retested the low. The commercials then bought the decline and by July 3, 1995 they were the most bullish in history (up to that point in time). From July 3, 1995 to October 8, 1996, heating oil prices went up 64%.
On June 25, 2013 the commercials were the most bullish in history (up to that point in time) and heating oil prices went up 12%. The commercials sold into the rally and heating oil retested the low. The commercials then bought the decline and by November 13, 2013 they were the most bullish in history. We shall see what happens next.
The #2, #3, #4 and #5 COT heating Oil Commercial Net yearly highs all saw 64.28% rallies within 463 days from the signal.
1.6428 (a 64.28% rally) * $2.85 (the price of heating oil at the November 13, 2013 signal low) = $4.69.
The all-time high in heating oil is $4.15. This indicator suggests heating oil will reach an all-time high by February 19, 2015.
Here is a link of heating oil contracts on the CME. February 2014 is the most widely traded contract for heating oil. This contract is currently priced at $2.9375 a gallon. Of the 29 heating oil contracts which have recently traded, the February 2014 contract is the highest priced. The farthest out contract which had recent trading activity is the September 2016 contract. As of this writing the price for the September 2016 contract is $2.6499. That happens to be the lowest priced contract. So market participants are expecting heating oil prices to go down in a slow but steady fashion over the next couple of years. This means that heating oil is trading in backwardation. This is good news for somebody who intends to speculate on heating oil prices going up.
Is there an ETF which tracks heating oil? Yes. Its ticker symbol is UHN. The average daily dollar volume is $89,451 which is very small. The only reason to buy UHN would be you don’t have a futures account but want to capture at least some of the expected heating oil rally.
As usual, the futures market is the most efficient way to play a commodity. This is because you are in control of what contracts you want to buy rather than an ETF fund manager. Commodity ETFs are a butcher’s knife and futures are a scalpel. Futures are also quite beneficial if you are expecting a long term rally. This is because any increase in the long term contracts goes right into your pocket. Most commodity ETFs often have a bias towards near term contracts because they are more liquid. So when the near term contract nears expiration and the ETF manager sells it and has to buy the next contract, the new contract’s price probably has already gone up a bit more than the old contract.
Heating oil has contracts for each month. This is not the case with many other commodities. This is convenient because you can get really precise with matching your expectations of how long the rally will last with the actual contracts. You may want to match up the contracts you buy with the Equivalent Dates listed in the earlier table.
| Contract |
Price |
Volume |
| July 2014 |
$2.90 |
1,849 |
| December 2014 |
$2.89 |
2,440 |
| February 2015 |
$2.85 |
42 |
| May 2015 |
$2.84 |
8 |
Since heating oil is trading in backwardation, if we get a rally, you will make not only the money from the move from $2.93 to $4.69 (or whatever the peak is) but also the money from the farther out contracts’ price to the current price of $2.93. While the prices for these far out contracts are only 1% to 3% below the current price, it is a nice little bonus so why not take it? As we have seen in some of the December Absolute Value Research missives with corn, coffee and copper, when you go more than a year out in some of these commodity contracts, liquidity dries up. However, there is plenty of time to start working into long term positions.
Every time the commercials get very bullish on heating oil, the commodity goes up by 64% within 463 days. If history repeats, heating oil will reach an all-time high by February 19, 2015.
Indicator: COT Heating Oil Commercials Net Position
Inception: January 15, 1986
Frequency: Two times a month through September 30, 1992, then once a week
November 12, 2013 Percentile: 100.0%
December 17, 2013 Percentile: 87.1% |