Precious Metal Stocks went up 3% three days in a row. What’s next?
March 2, 2014
The $XAU is the oldest daily precious metals stock index. On February 11, 2014 the $XAU went up 3% for the third day in a row. This research report will take a look at all the other instances when gold stocks went up 3% three days in a row and see what has happened afterwards.
The inception date of the $XAU is December 19, 1983. Since then, there have been nine Winter Olympics.That is two more than the number of times the $XAU went up 3% three days in a row (7). Here are the dates of the third 3% day:
August 3, 1984
November 25, 1987
November 27, 1987 ($XAU up 3% for the 4th trading day in a row on the day after Thanksgiving)
February 26, 2001
October 30, 2008
July 23, 2013
February 11, 2014
After taking a look at the charts, a startling pattern emerges. The pattern is
- First gold stocks have a bear market.
- Then there is an initial rally after the bear market.
- The initial rally after a bear market is the only time when gold stocks go up 3% three days in a row. They have not gone up 3% three days in a row in the middle or end of a bull market.
- After gold stocks go up 3% three days in a row, the reward/risk for owning them has been low.
- After the initial rally, gold stocks have had a 19.8% to 34.22% drawdown.
From March 6, 1984 to July 24, 1984, gold stocks went down 41.87%
From the August 3, 1984 signal, gold stocks went up 3.79% to their peak which was 61 days later.
After their October 3, 1984 peak, gold stocks went down 29.36% over the next 96 days.
From September 18, 1987 to November 10, 1987, gold stocks went down 46.54%.
From the November 25, 1987 signal, gold stocks went up 15.43% to their peak which was 5 days later.
After their November 30, 1987 peak, gold stocks went down 34.22% over the next 65 days.
From September 18, 1987 to November 10, 1987, gold stocks went down 46.54%.
From the November 27, 1987 signal, gold stocks went up 5.65% to their peak which was 3 days later.
After their November 30, 1987 peak, gold stocks went down 34.22% over the next 65 days.
From September 28, 1999 to October 25, 2000, gold stocks went down 55.12%.
From the February 26, 2001 signal, gold stocks went up 7.27% to their peak which was 11 days later.
After their March 9, 2001 peak to April 3, 2001, gold stocks went down 19.8% over the next 25 days.
From September 23, 2008 to October 24, 2008, gold stocks went down 57.64%.
From the October 30, 2008 signal, gold stocks went up 12.56% to their peak which was 6 days later.
After their November 5, 2008 peak, gold stocks went down 28.77% over the next 15 days.
From September 21, 2012 to June 26, 2013, gold stocks went down 58.17%.
From the July 23, 2013 signal, gold stocks went up 11.22% to their peak which was 35 days later.
After their August 27, 2013 peak, gold stocks went down 30.8% over the next 114 days
From August 27, 2013 to December 19, 2013, gold stocks went down 30.80%.
From the February 11, 2014 signal, ???
???
In the following tables, the initial downside is calculated from the signal date (not from the high of the rally). This is done to better assess the reward/risk characteristics of the signal.
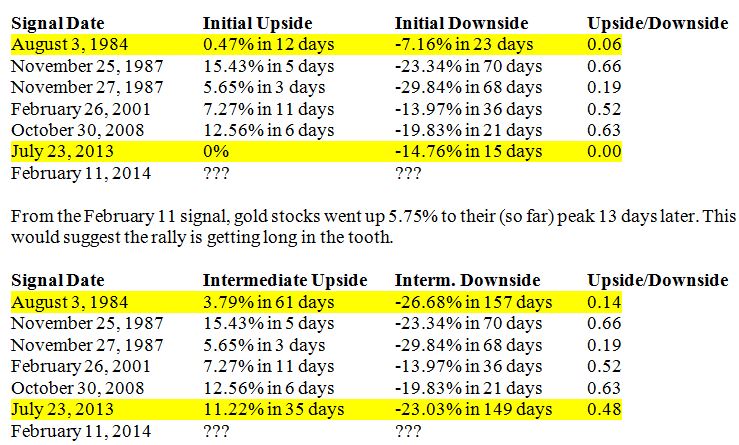
In 1984 and 2013, gold stocks had an initial quick descent, reversed and hit new highs before reversing yet again and hitting much lower lows.
In summary, every time gold stocks go up 3% three days in a row, they have a 13.97% to 29.84% decline from the signal within a few months. Prior instances led to a 19.8% to 34.22% decline from the rally peak to the subsequent low.
Indicator: $XAU up 3% three days in a row
Inception: December 19, 1983
Frequency: Daily
February 11, 2014 percentile: 99.9%
|