It is Time to Start Planting the Seeds of Wheat Longs
February 2, 2014
In December and January Absolute Value Research looked at several Commitment of Traders Reports indicators which were near all-time extremes. It was mentioned that most of the COT reports are not predictive, but sometimes you can find a diamond in the rough. To demonstrate what is meant by this, today’s missive will take a look at each of the 10 main COT reports for wheat.
How do we go about determining whether or not an indicator is useful?
The first step is to ask whether the indicator is at some sort of extreme. If the indicator is in the middle of its range, it probably isn’t going to be much help right now.
If the indicator is at an extreme, the next step is to study what has happened next in the past when the indicator was at an extreme.
For the 10 graphs below, the upper chart is the COT indicator and the lower chart is wheat.
Wheat Commercials Long
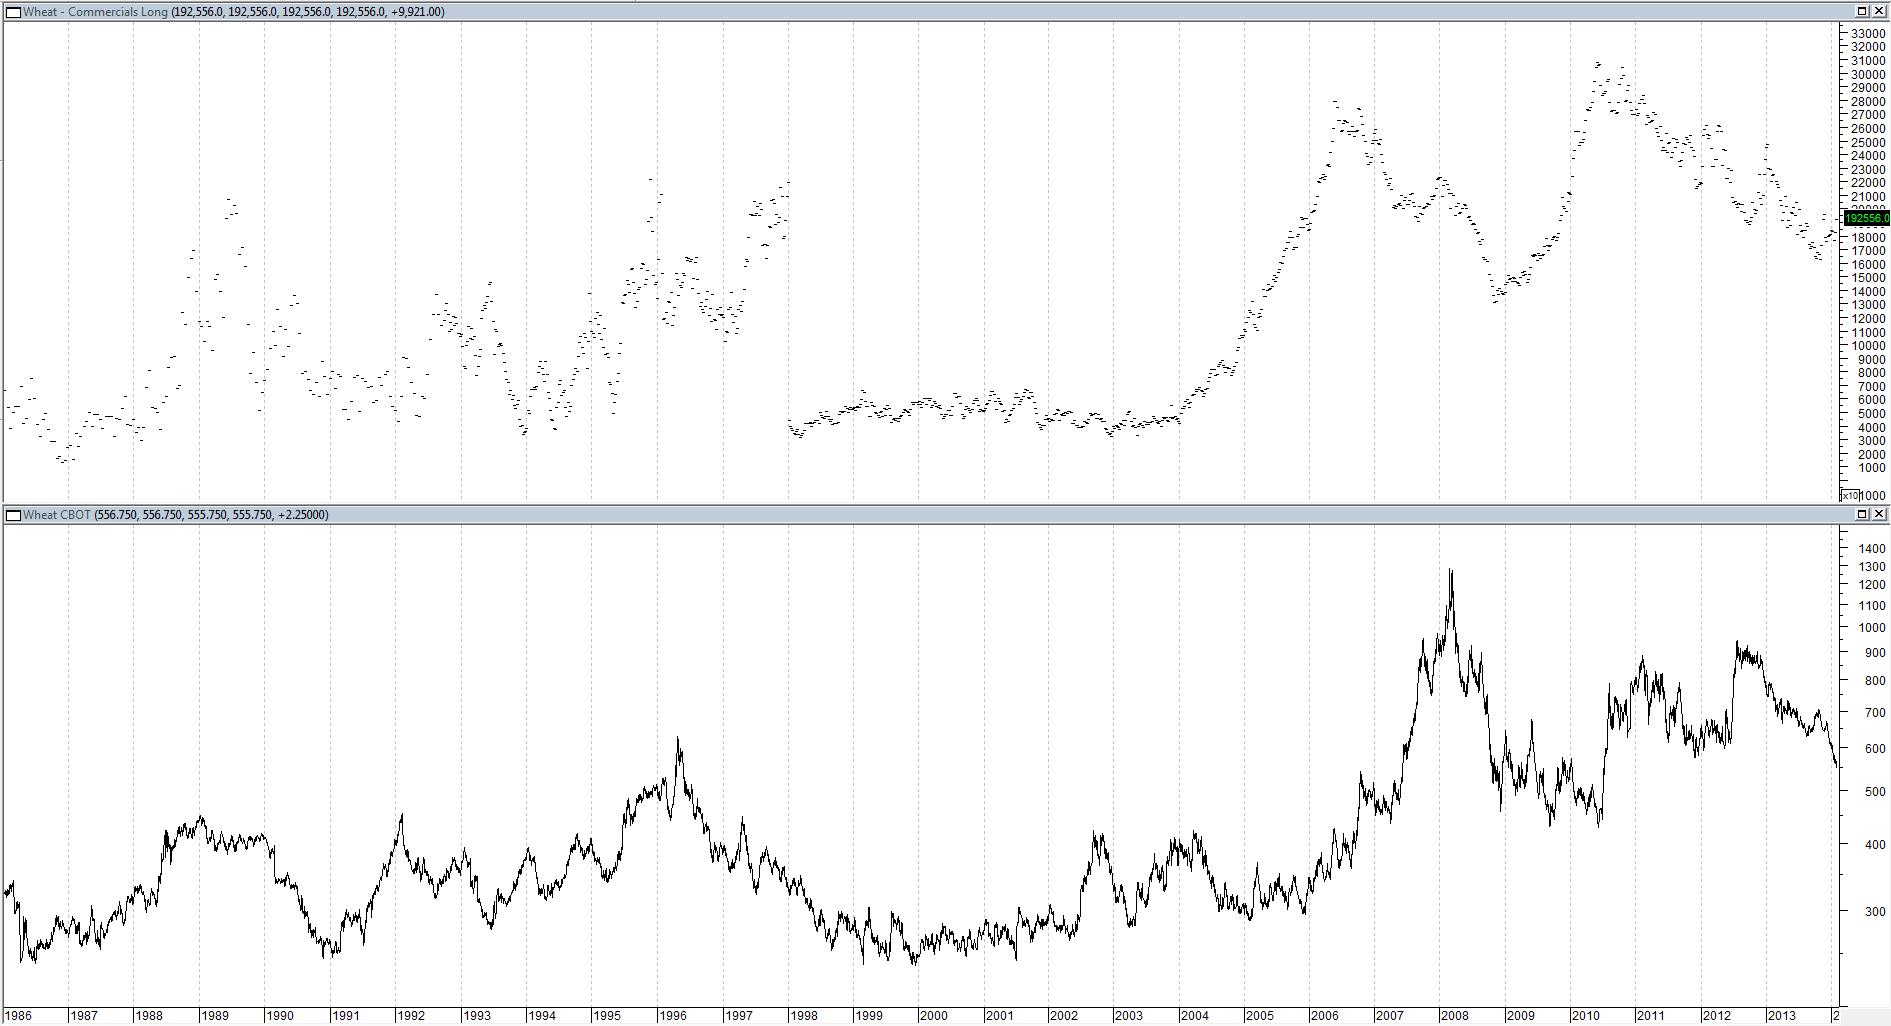
This indicator is not at an extreme. Therefore, it isn’t useful to us now, irrespective of whether or not the indicator is predictive. So let’s move forward.
Wheat Commercials Net
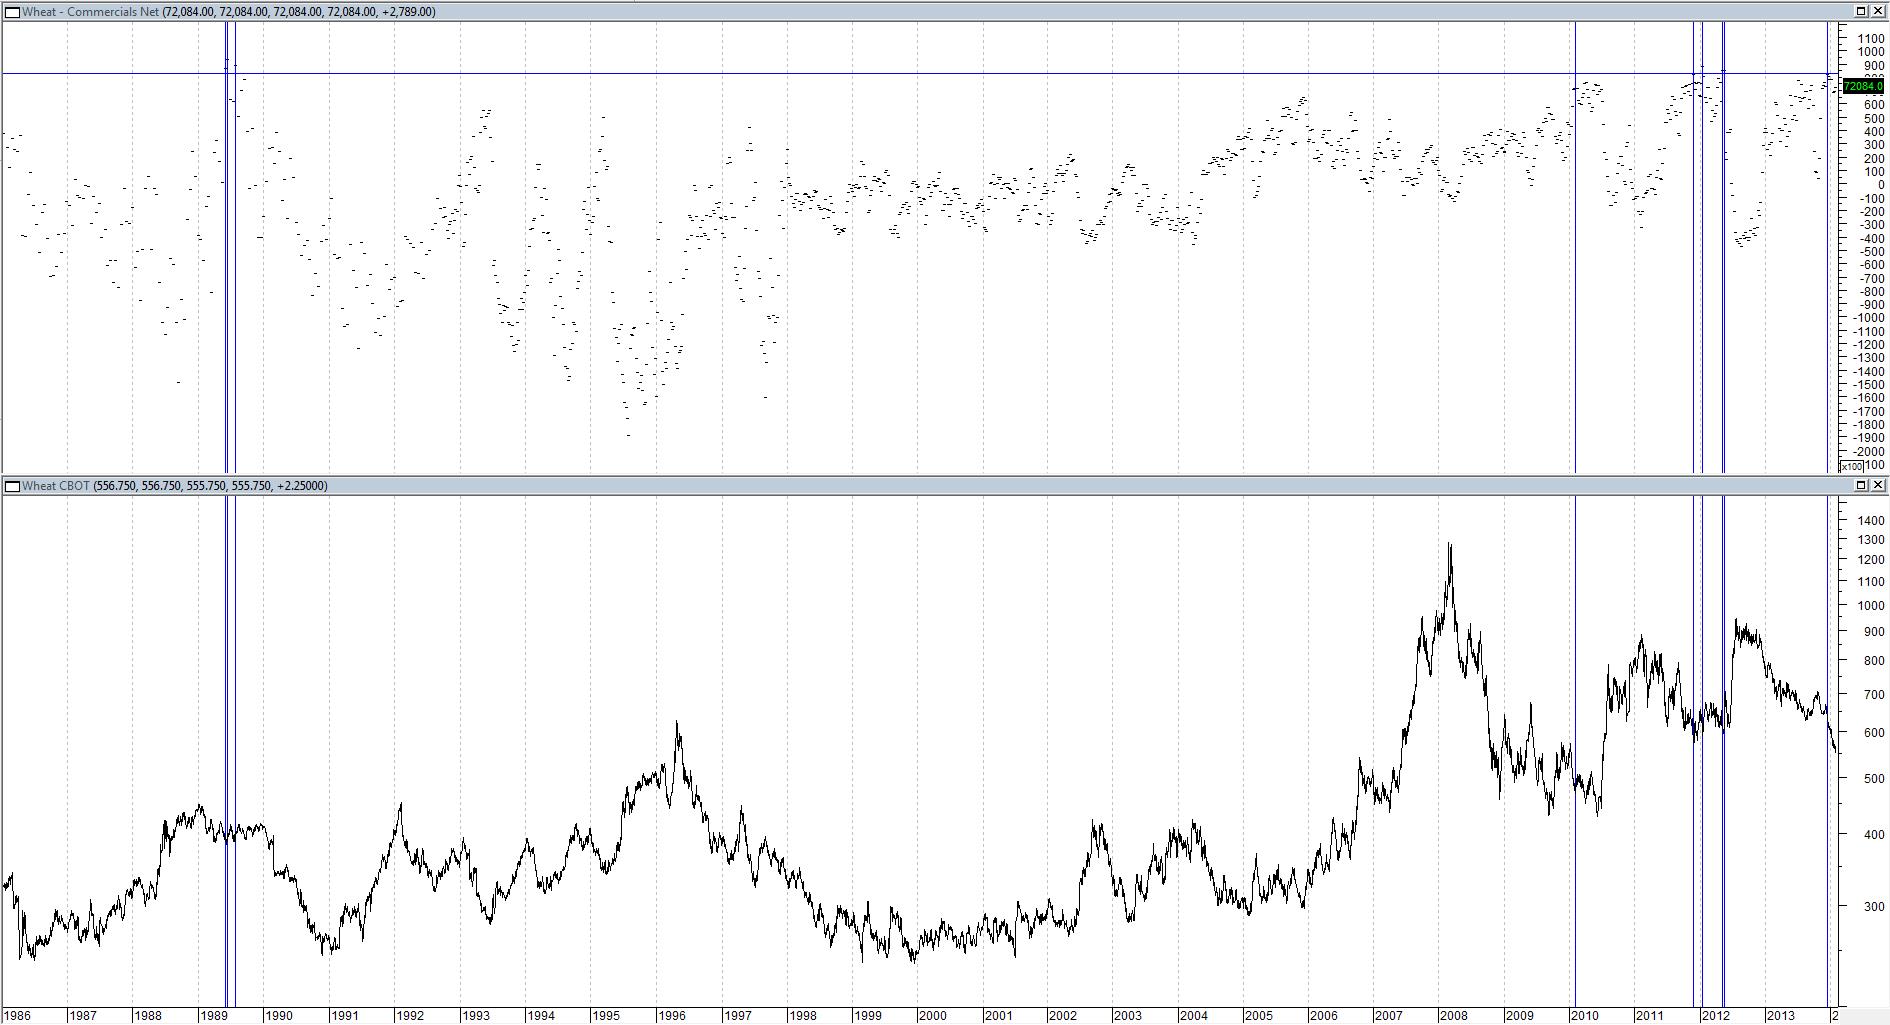
On December 10, this indicator was near an extreme.
Here are the other times the commercials were this net long wheat:
1989 Wheat was flat for months, then went down
2010 Wheat went down for a few months, then up
2011-2012 Wheat went up
The results were mixed. Therefore, this indicator does not inspire much confidence in its predictive value. Let’s see if there is a better one out there.
Wheat Commercials Short
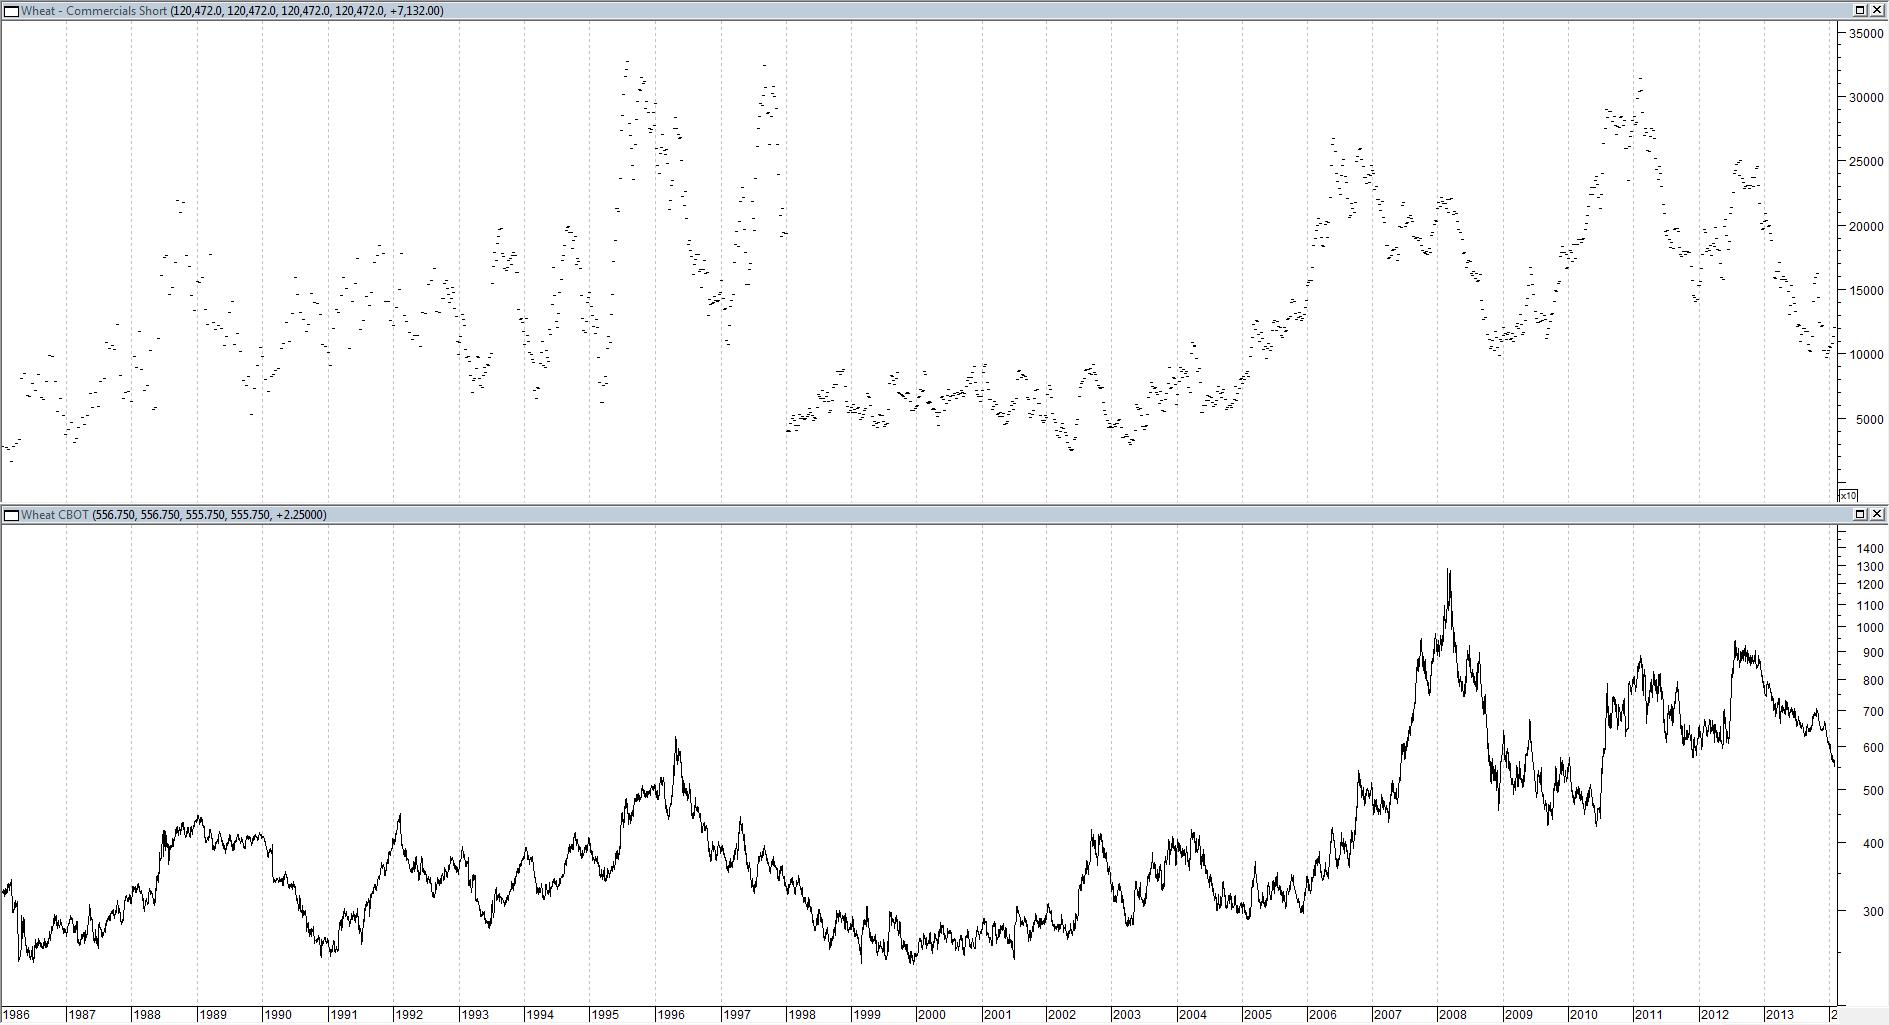
The Commercials are not at an extreme with respect to their short positions. Therefore, on to the next one.
Wheat Non-Commercials Long
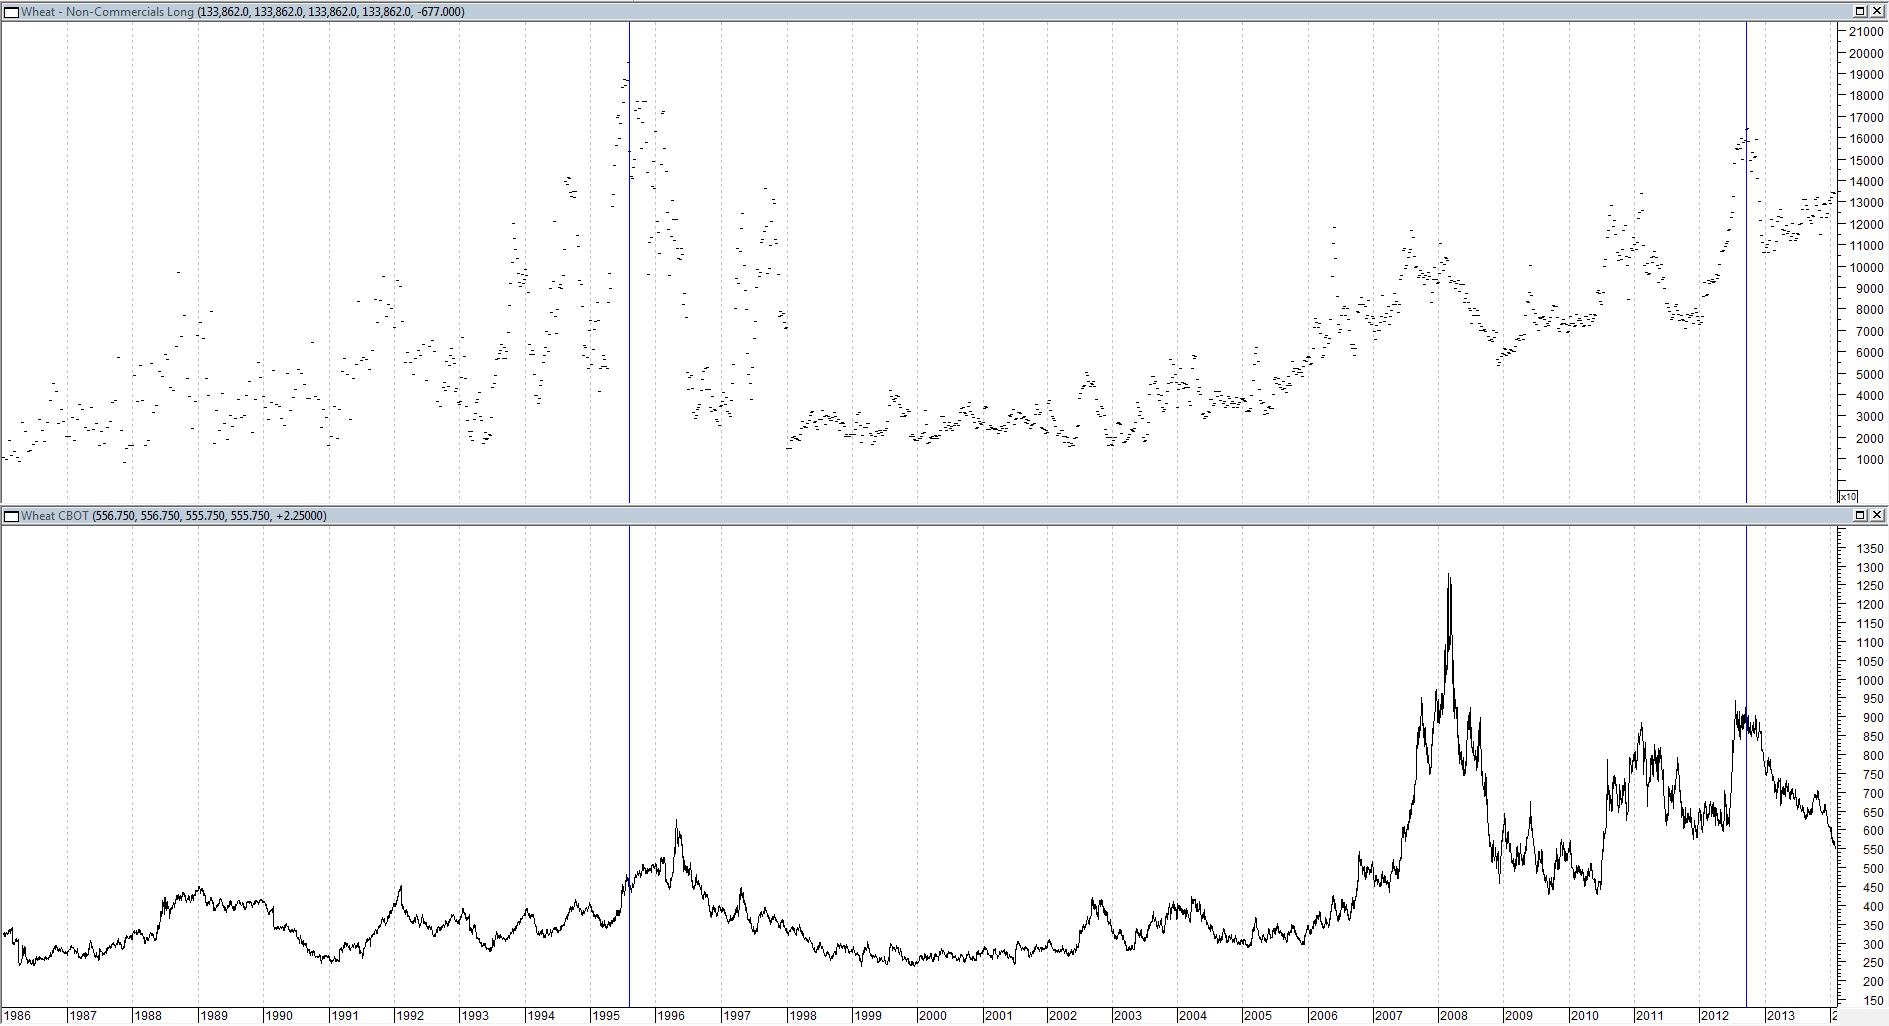
The Non-Commercials are getting fairly long wheat. The problem is it is debatable what exactly this means. The Non-Commercials have been very long wheat twice:
1995 Wheat went up quite a bit for about nine months, and then went down.
2012 Wheat went down.
Another mixed result. Therefore, the indicator is not good. Next.
Wheat Non-Commercials Net
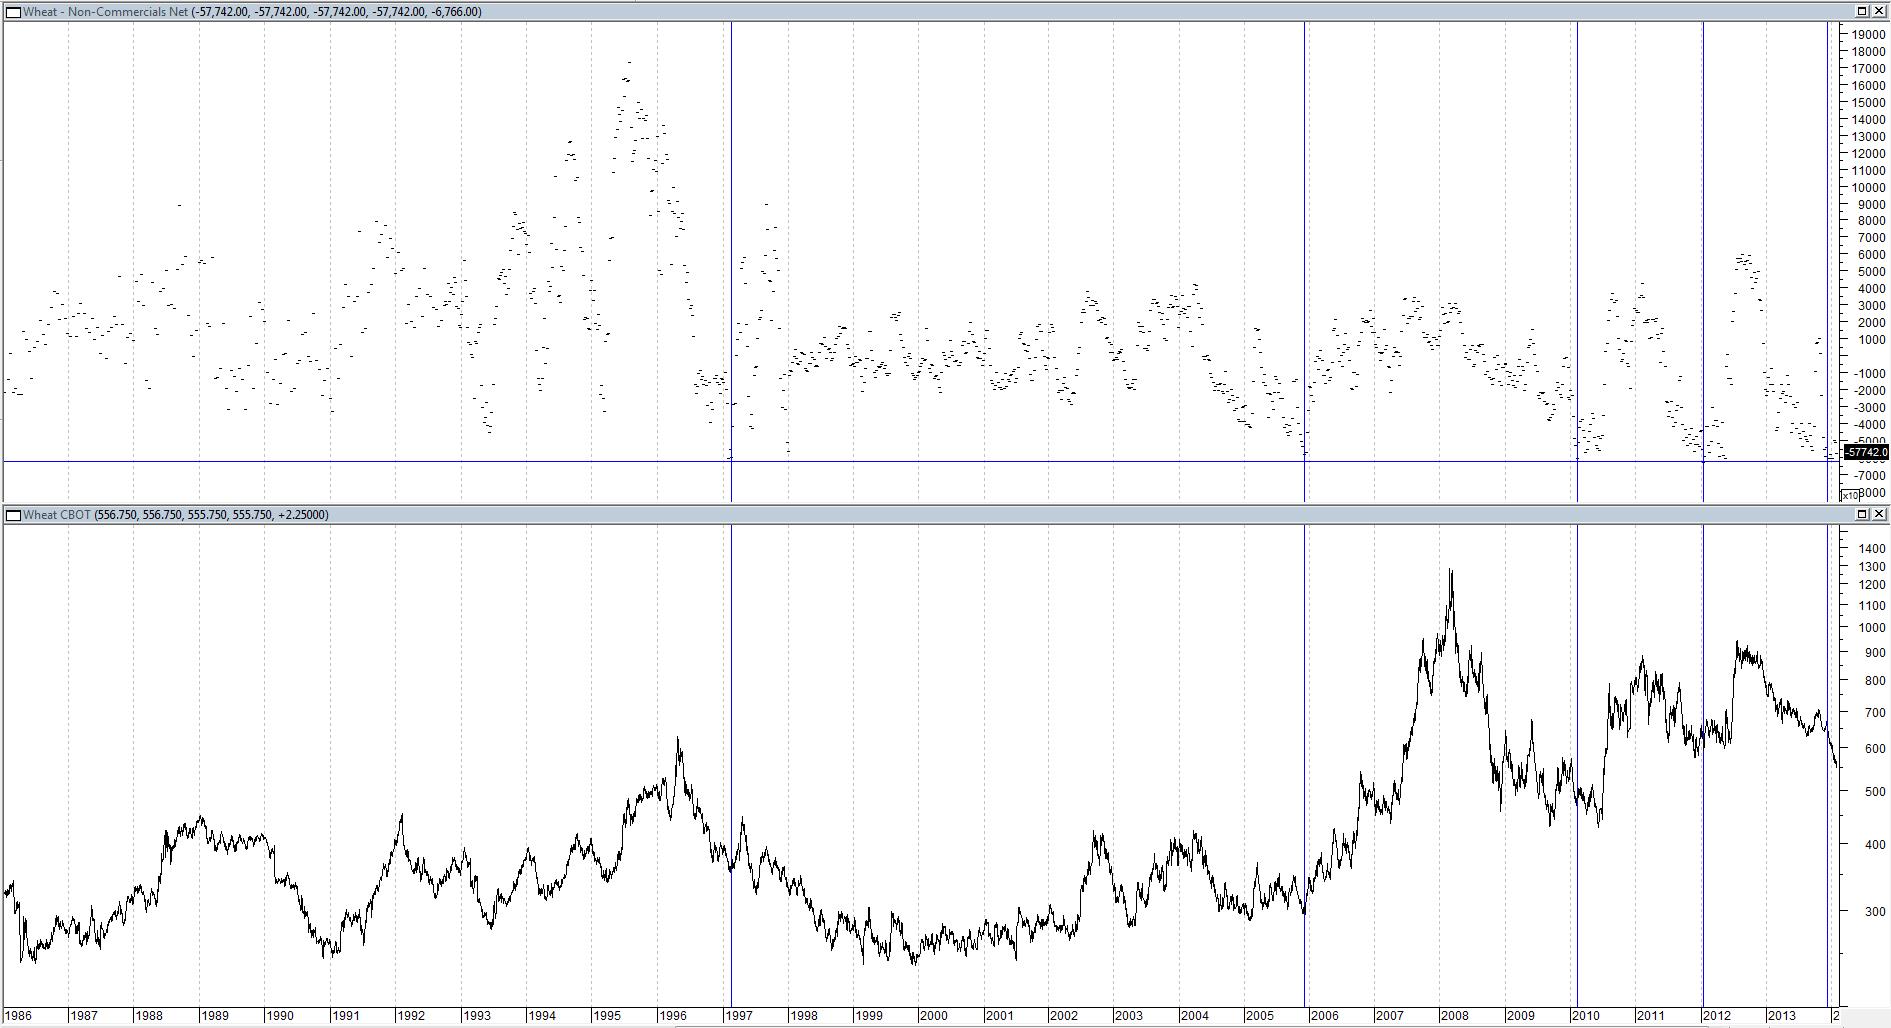
The indicator recently reached its second lowest level in history. Here are past low extremes which are designated by blue lines in the chart above and highlighted in green in the table below:
02/04/1997 -60,305 28% in 2 months 17 days
02/18/1997 -60,025
12/06/2005 -58,011 334% in 26 months 21 days
02/09/2010 -60,457 85% in 12 months 0 days
01/17/2012 -62,545 56% in 6 months 3 days
01/24/2012 -59,383
04/17/2012 -59,174
05/08/2012 -58,884
05/15/2012 -60,753
11/26/2013 -59,247
12/10/2013 -62,300 ???
12/17/2013 -60,619
12/24/2013 -58,377
12/31/2013 -61.992
01/07/2014 -60,369
This one looks promising. The February 1997 rally jumps out as being mediocre. However, by April 29, 1997, the Non-Commercials had changed their position from -60,305 to +57,930. They have been that bullish on wheat only 2 weeks post 1997. Those weeks were 8/21/2012 and 9/25/2012. Both were near the 7/20/2012 top in wheat. In other words, the non-commercials quickly turned very bullish which was a warning to sell. Plus wheat did have a 28% rally in two months which isn’t so bad anyway. Worry about when to sell after wheat has a rally.
So far that has not happened. This indicator’s recent low was on December 10. Since then, the price of wheat has decreased by 13%. However, wheat reacted similarly after the 2010 signal. The signal hit its low on February 9, 2010 and wheat went down 11% to its June 11, 2010 low. Wheat then staged a 108% rally.
One should be on red alert for a major inflection point in wheat at any time now.
Wheat Non-Commercials Short
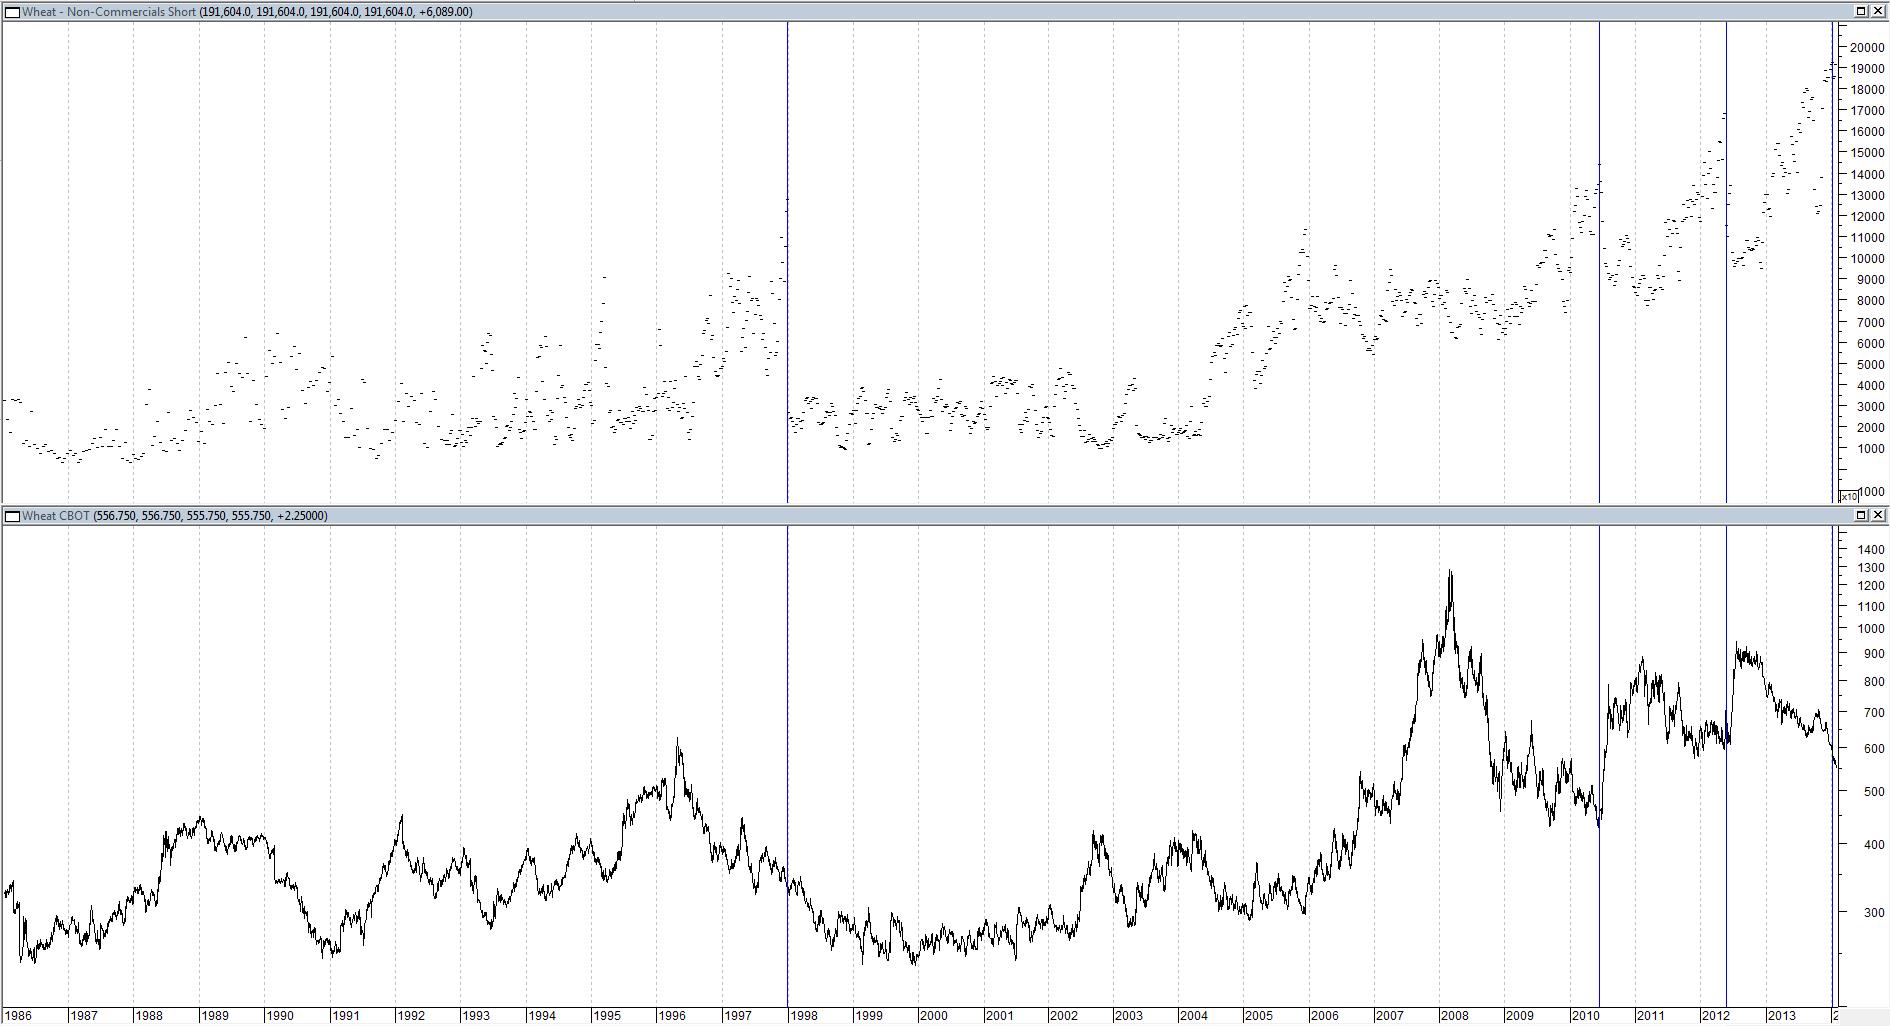
The good news is the indicator is at an extreme. The bad news is when this happens the results are somewhat dodgy.
High Extremes
2012 Wheat went up
2010 Wheat went up
1997 Wheat went down
One can argue that the 1997 reading wasn’t extreme enough and this indicator is now giving a bullish signal. While this may be true, the NC Net chart produces a higher comfort level than NC Short chart.
Wheat Non-Reportable Long
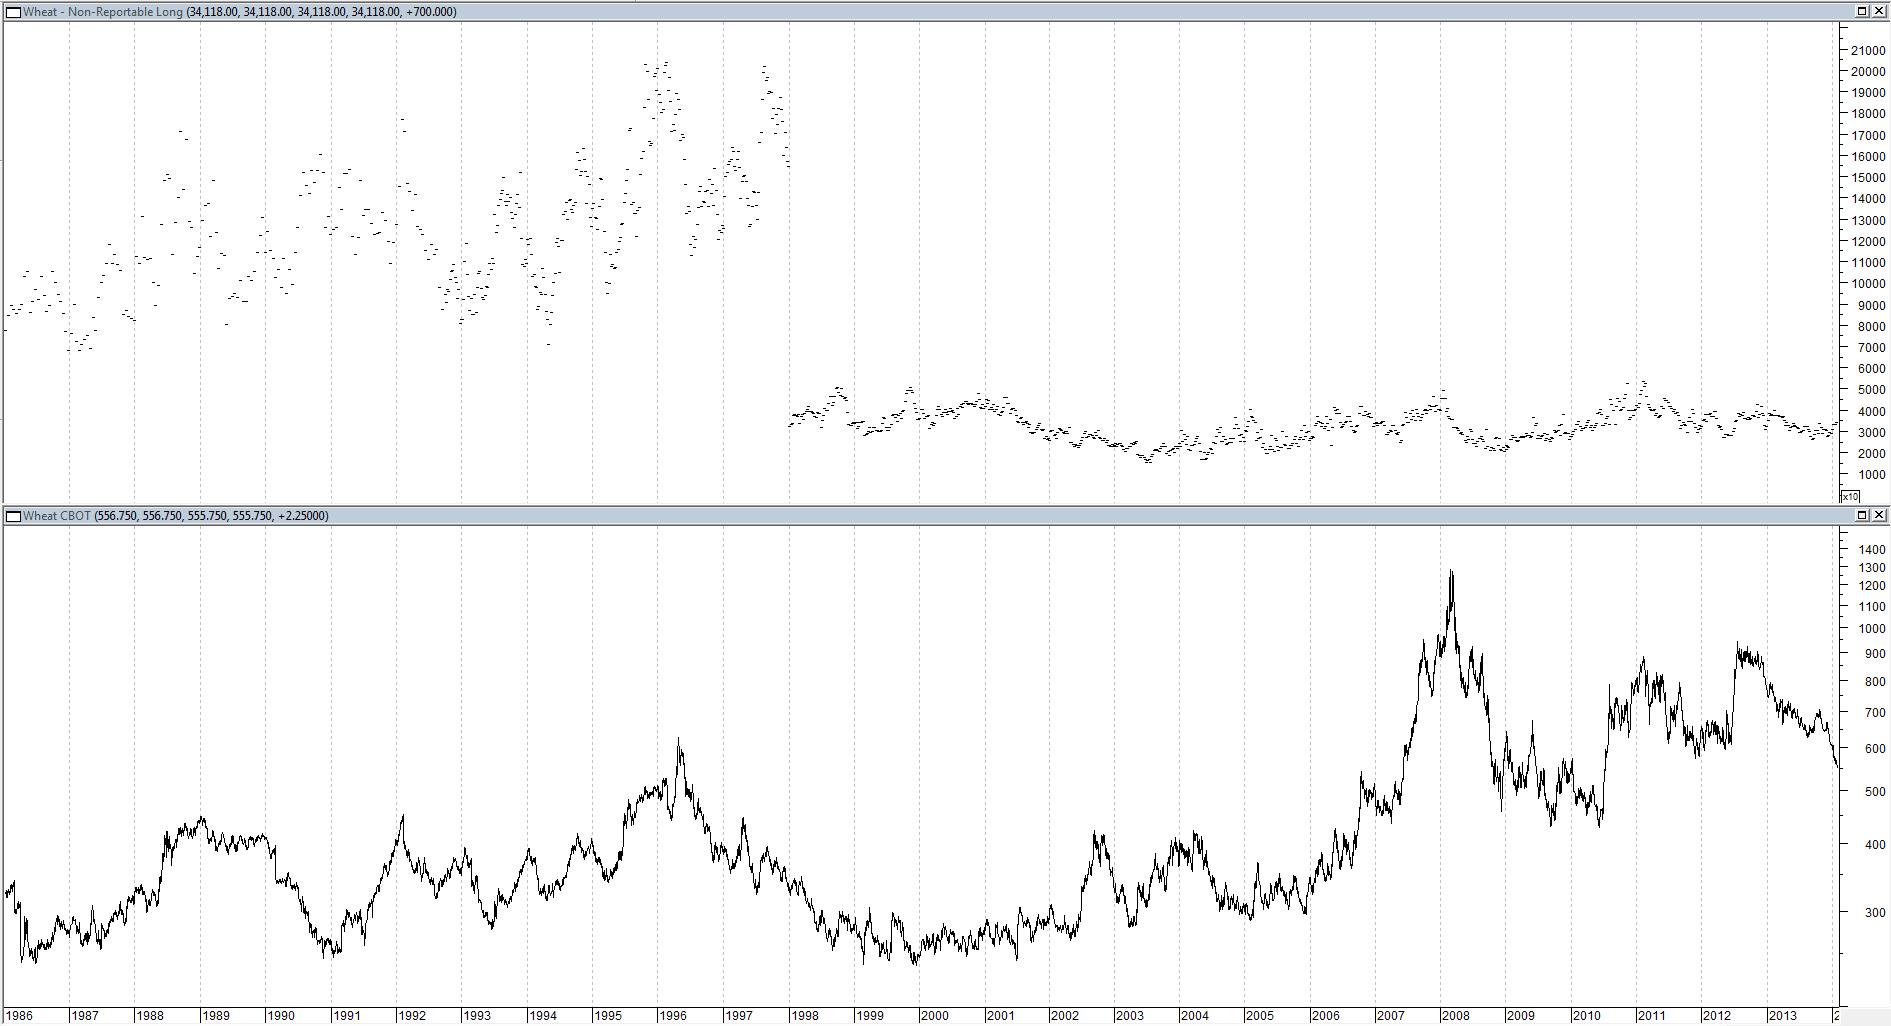
The recent readings are middle of the road for the post 1997 period. There doesn’t seem to be much reason to spend much time on this one.
Wheat Non-Reportable Net
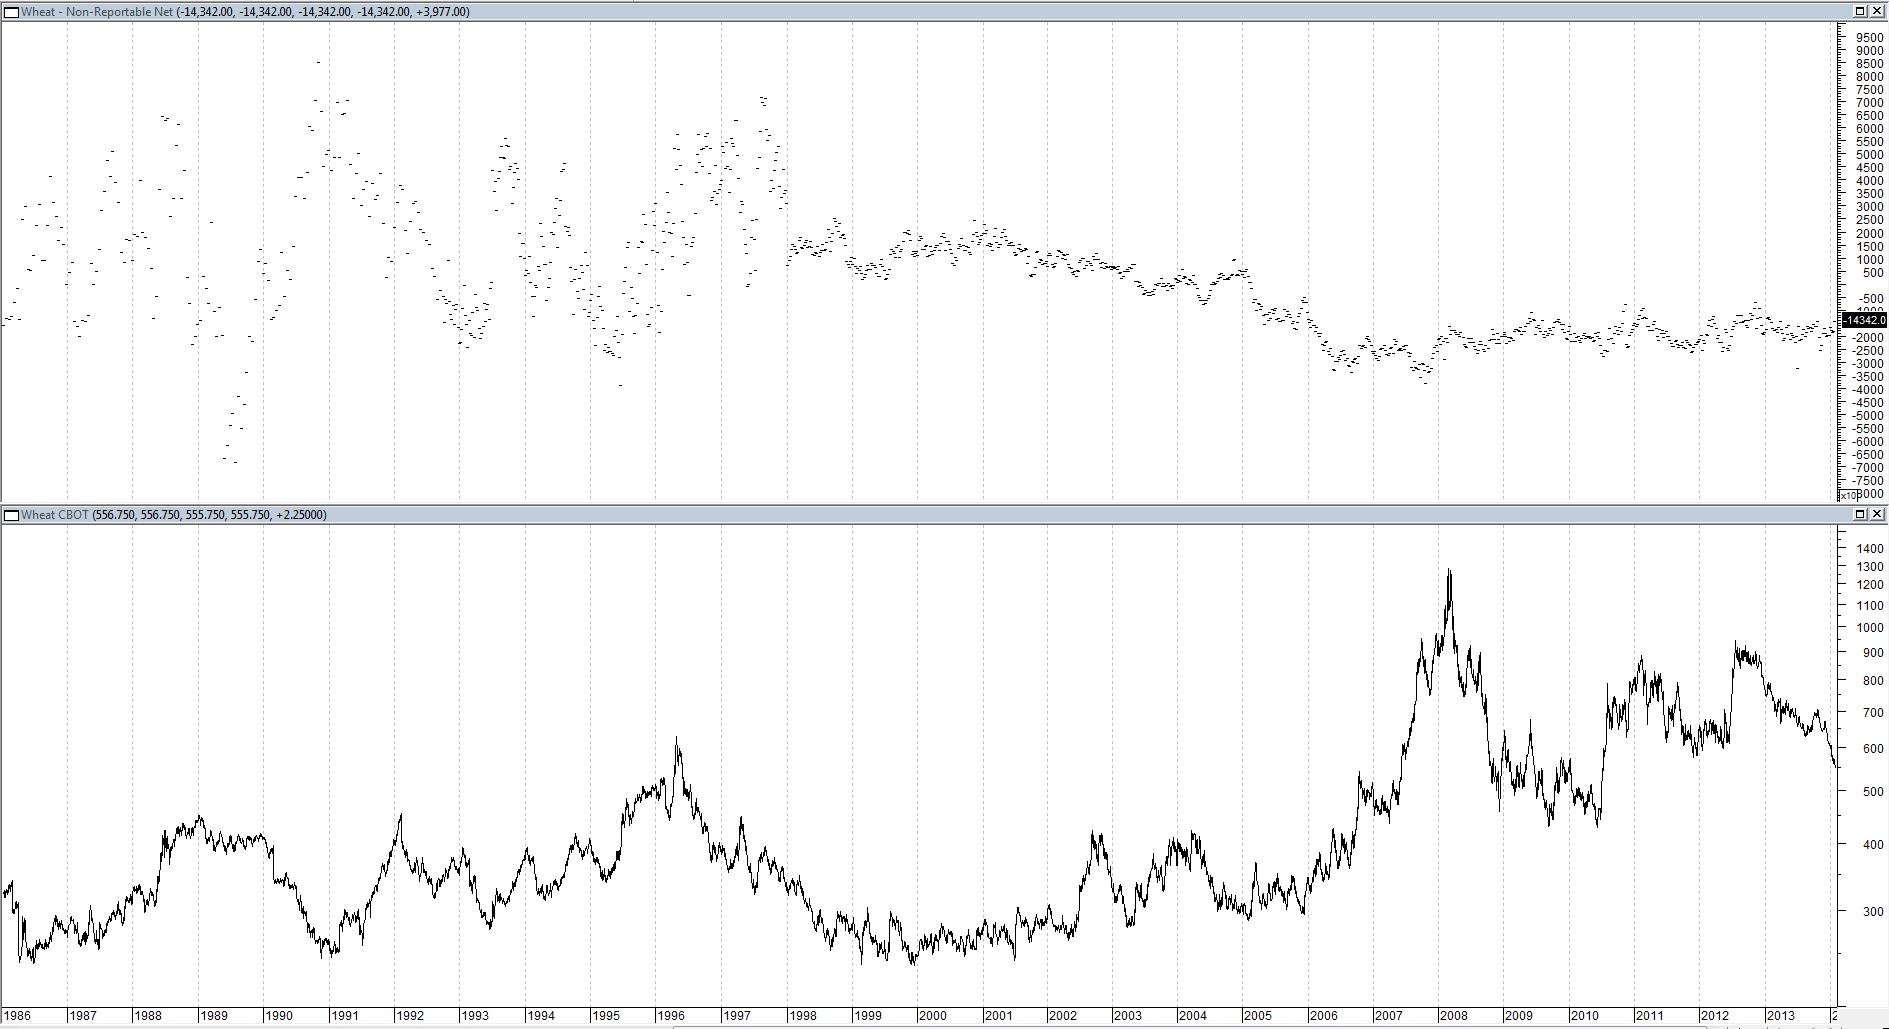
The current reading is kind of middle of the road for the last five years. Nothing really jumps out so let’s move on to the next one.
Wheat Non-Reportable Short
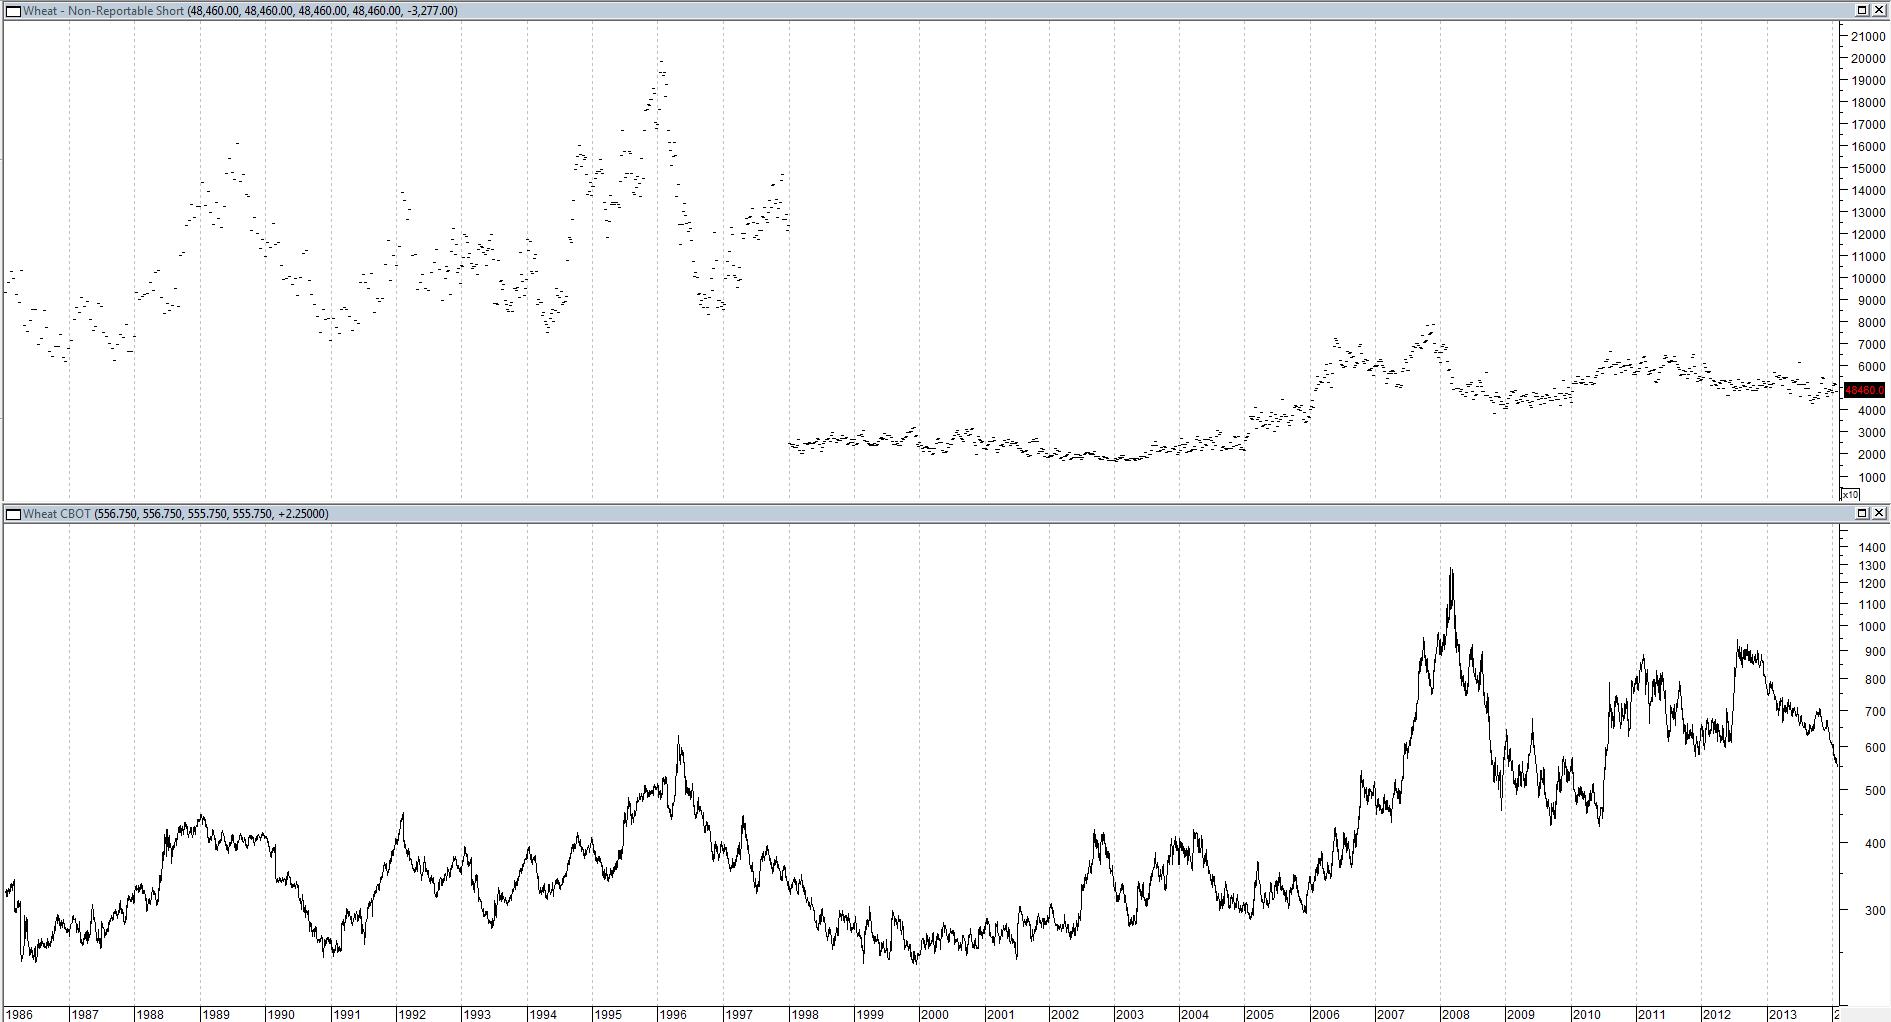
The Non-Reportable charts seem to be in no-man’s land and this one is no exception.
Wheat Open Interest
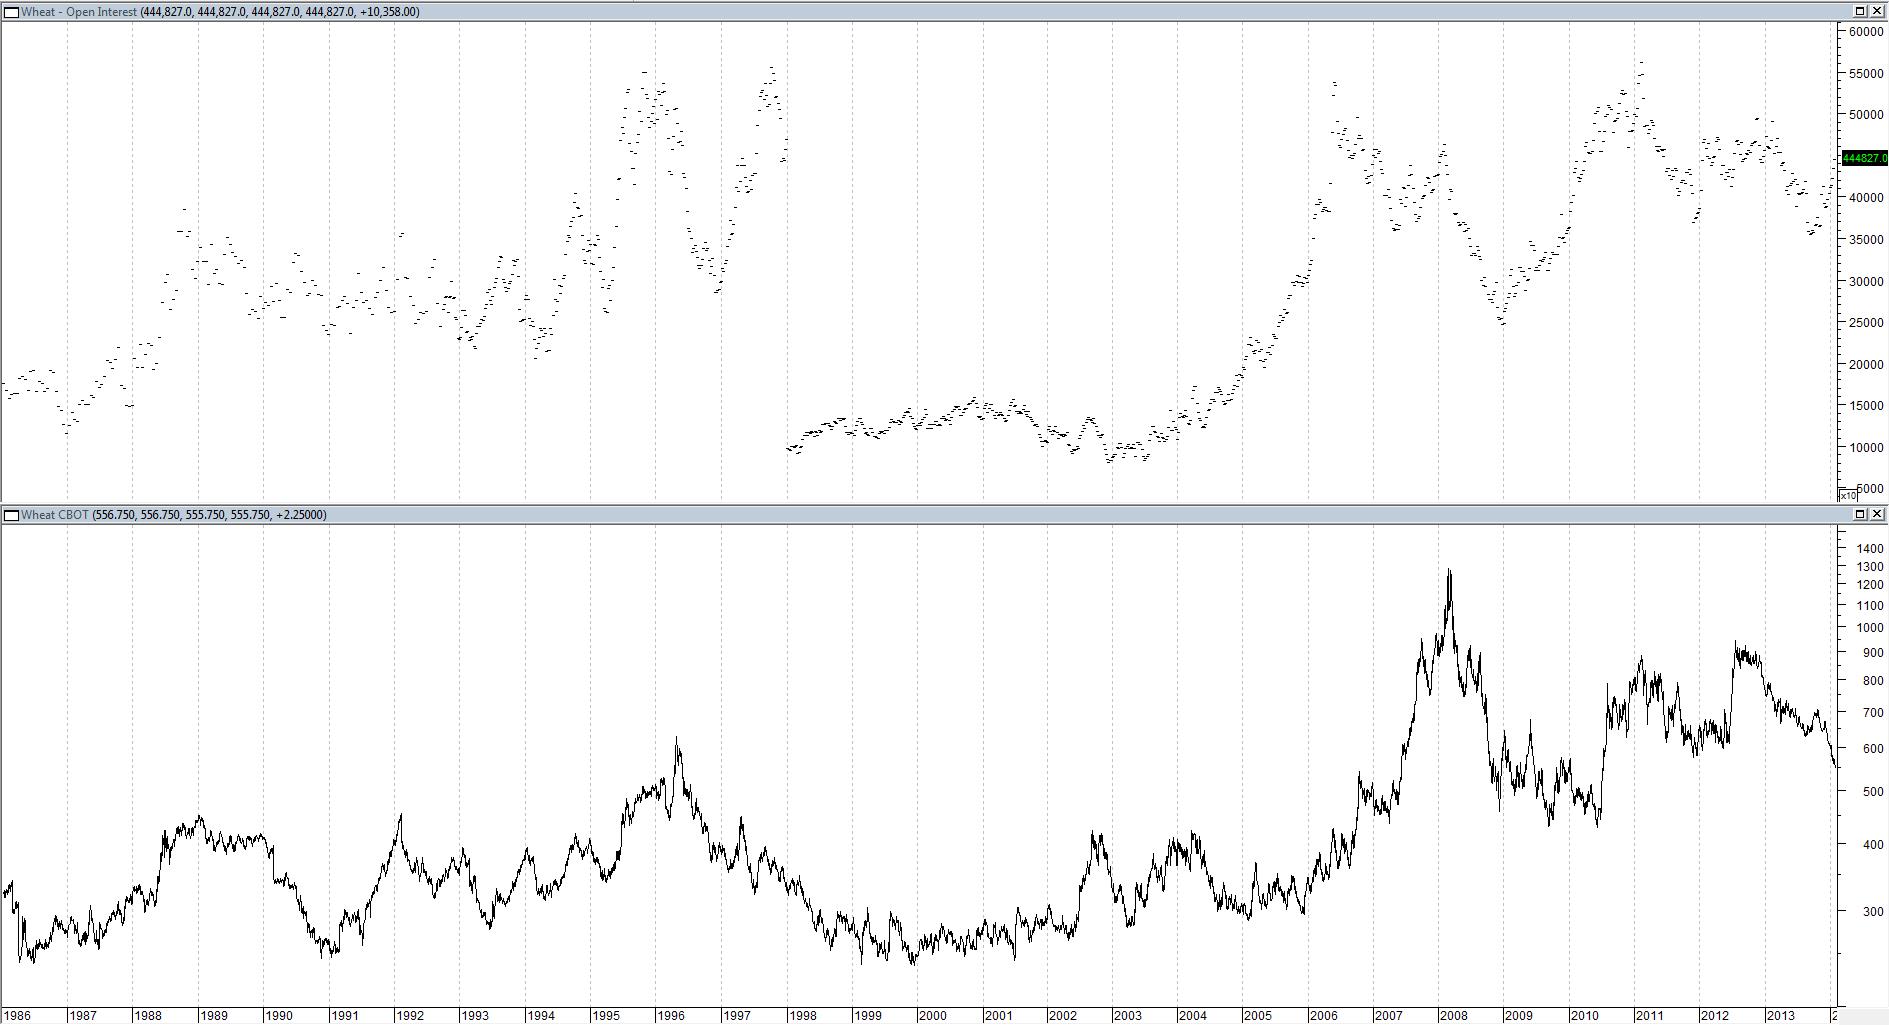
The open interest chart is different from the others as it gives a “total” of all open contracts. This chart is not at an extreme and a cursory examination does not inspire much confidence in its predictive value anyway.
Summary
The main purpose of this article is to help the reader be able to distinguish between a useful chart and a useless chart. The most useful COT indicator for wheat appears to be the Non-Commercials Net. There has been a confluence of extremes in the COT complex over the last few months. This is not normal. Let’s review the most predictive COT indicators for each asset covered by Absolute Value Research thus far:
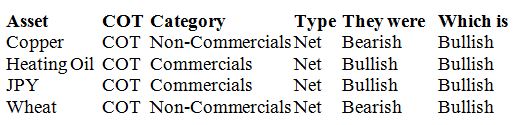
The “Net” category seems to be more predictive than the “Longs” or “Shorts”. The two most predictive categories thus far have been the Non-Commercials and Commercials. Conspicuously absent is the Non-Reportables category. The Non-Reportables are retail investors. Traditionally, most market commentators classify the Non-Reportables as the “dumb money”. But if one takes the time to actually look at the data, the hedge funds (Non-Commercials) seem to be a better contrarian indicator than the retail investor. The majority of hedge funds are trend followers. The longer and more obvious the trend, the more money they throw at it. The hedge funds don’t seem to have a particularly good track record at catching major inflection points. The trend is your friend until the end at the bend. If history repeats, the hedge funds are once again going to overstay their welcome on the short side.
Indicator: COT Wheat Non-Commercials Net Position
Inception: January 15, 1986
Frequency: Two times a month through Sep. 30, 1992, then 1x a week
Indicator Percentile (Dec.10, 2013) 0.0%
Indicator Percentile (Jan. 28, 2014) 1.1%
|