Coffee indicator at levels which has always led to 517% returns
by James Debevec II
December 15, 2013
Trivia: Who was the president of the United States when coffee hit its all-time high?
The first research report of Absolute Value Research concluded that other assets were becoming more attractive than stocks. Last week we looked at corn. This week we will look at coffee.
Perhaps the single most important event in the economic history of the United States was the Gold Reserve Act. With a single stroke of a pen, FDR changed the nominal price of gold from $20.67 to $35. This would usher in the Not So Golden Age of Inflation. Many long term commodity charts look the same. From the inception of their chart to around 1933, many commodities oscillated around an invisible “Fair Value” line like a sine wave. Then, somewhere around 1934, the line starts going up.
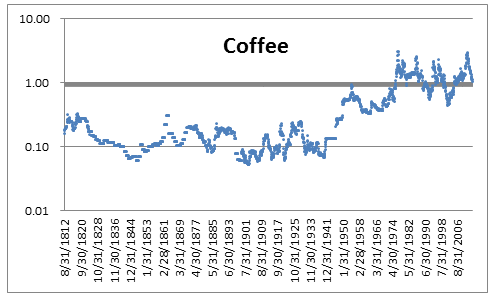
Here is a monthly chart of the price of coffee going back to August 31, 1812.


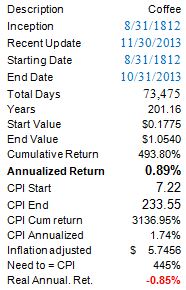
The above analysis ends on October 31 rather than November 30 because the November Consumer Price Index (CPI) number does not get released until December 17. The CPI is the inflation index.
From the monthly data’s inception of August 31, 1812 to October 31, 2013, coffee went up 493%. That isn’t very much for 201 years. Historically, coffee’s real (i.e. after inflation) return is -0.85% per year. A negative real return is common in agricultural commodities. One explanation for this is advances in farming technology.
Coffee’s all-time high was on April 14, 1977 at $3.40 a pound. The answer to the trivia question is Jimmy Carter.
Coffee then went into a 24.5 year 87.5% bear market. Coffee bottomed in the post 911 melee on October 22, 2001 at $0.425 a pound.
Coffee then experienced a 9.5 year 620% secular bull market (i.e. with minor bear markets in the middle) and peaked on May 3, 2011 at $3.0615.
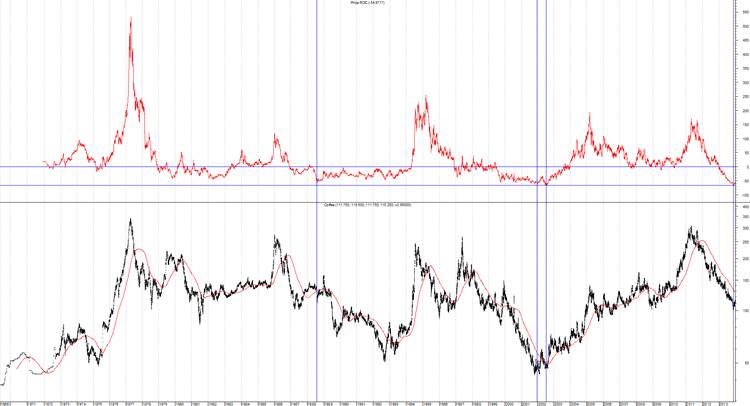
Coffee then collapsed by 66.49% and has bottomed (thus far) on November 14, 2013. This decline lasted around 2.5 years or 641 trading days. Coffee’s 641 trading day Rate of Change is the indicator which we are going to examine today.
Has coffee gone down 66.49% in 641 trading days before?
Not since at least June 2, 1969 where chartrus.com’s daily coffee data starts. The lowest three readings of all-time were November 11, 13 and 14 of 2013. The fourth lowest reading of all-time was -65.42% on July 10, 2002. From the July 10, 2002 signal, coffee went up 517% in less than nine years.
Here are the four lowest yearly low readings:

The top chart in the picture below is the Coffee ROC (641) indicator and the bottom chart is coffee. The blue vertical lines match up with the signals in the above table.

Dropping the statistics for a paragraph…look at the recent 2.5 year move down in coffee. What other period does it most closely resemble? You can see there were a few times when coffee got hit very hard. These dramatic bear markets have always been followed by big spikes up. The recent bear looks the most similar to the 2000-2001 bear. That was a good time to buy coffee.
Coffee is traded on two different exchanges with two different prices and symbols. The CME prices its coffee quotes in dollars (symbol KT $1.15) and ICE in cents (symbol KC 115 cents). While ICE lists a December 2013 contract (volume of 18), March 2014 is currently the most widely quoted contract (volume of 15,751). This research report mostly uses the $1.15 price but the above chart uses 115 cents.
If you look closely at the chart, you will notice that after every big oversold reading, coffee rallies for a few months, then has a correction or a bear market.
Coffee went up 44% in 5 months from August 2, 1988 to January 3, 1989. It then resumed its bear market.
Coffee went up 40% in 5.5 months from October 22, 2001 to April 3, 2002. It then had a 16.2% correction to July 10, 2002.
Coffee went up 47% in 3.5 months from July 10, 2002 to October 25, 2002. It then had a 19.5% correction to June 20, 2003.
Notice how similar the rallies were. Coffee contracts expire in March, May, July, September and December. This indicator in isolation suggests the March or May coffee contracts would be the best bets. Since the initial thrust typically lasts only a few months, ETFs will probably do an excellent job of capturing this move. JO currently invests in one contract which is typically the most active contract (right now March). CAFE may invest in a number of contracts in an effort to reduce contango. Since this indicator suggests the initial phase of the rally is only going to last until the March or May contract, JO is probably a better bet. As a bonus, JO also has about 17 times the volume of CAFÉ.
Coffee has traditionally been a poor investment. However, there are certain rare instances when coffee can offer superb returns. If history repeats, that time is now.
Indicator: Coffee ROC (641)
Inception: June 2, 1969
Frequency: Daily
November 14, 2013 Percentile: 0.0%
December 15, 2013 Percentile: 1.9%
James V. Debevec II is the founder of AbsoluteValueResearch.com |