Indicator suggests corn set to have aMAIZEing returns
By James Debevec II
December 8, 2013
Absolute Value Research’s last missive left readers with a cliffhanger by stating “there are other assets which have indicators giving off buy signals just like equities did 16 months ago. These assets have a more favorable reward/risk profile than stocks do now.” This article will examine one of the indicators of one of those assets.
The price of corn reached its all-time high on August 21, 2012. It then went down 50.4% and bottomed on November 18, 2013. That equates to 314 trading days. So the first question you should ask is has this ever happened before? And the next question you should ask is, if it has, what has happened next?
For these answers, let’s turn to chartrus.com which has data for corn going back to January 3, 1949.
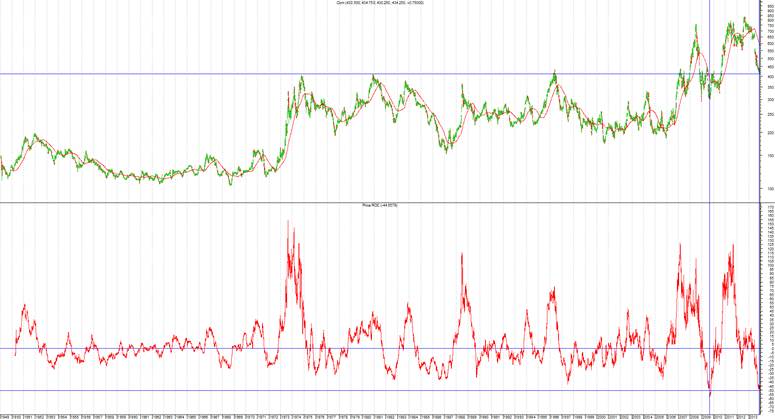
The top chart is corn. The bottom chart is the 314 trading day rate of change (ROC) in corn.
The only days which the Corn ROC(314) indicator was lower than November 18, 2013 were September 2, 2009 to October 5, 2009.
From September 2, 2009 to Jun 10, 2011 corn went up 155%.
Let’s take a look at all the major lows in the corn ROC(314):
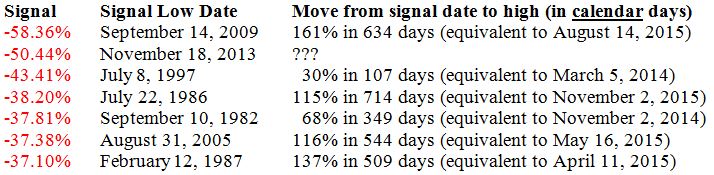
Corn has rallied a bit off the low which has brought the indicator up to -44.56%. This is still lower than all previous instances besides those surrounding the 2009 and 2013 bottoms.
Unfortunately, other market participants also anticipate corn prices going up. Click here for a list of corn futures contracts with different expiration months.
For readers who don’t normally trade in commodities, the price of corn is currently around $4.33 per bushel. A price of $4.33 on the CME website is listed as 433’4 because the contract pricing unit is cents per bushel. That extra $0.004 is important when dealing with large quantities of money. Also note the most commonly quoted price for corn is actually the March 2014 contract because it has about 57 times more volume than the December 2013 contract.
The December 2013 contract is 424 cents per bushel. The farthest out recently traded contract is the December 2016 at 470’6. So market participants are expecting corn to go up by 11% over the next three years. Corn is expected to peak in May 2015 at 480. That is a 13.2% increase from December 2013. When prices for the contracts out in the future are higher than the spot price it is called contango. So in order for speculators in corn to make money, the futures contract needs to go up even higher. It is possible for corn to go up 12% and still lose money.
The good news is if corn has its worst rally in the signal’s history (+30.7%) it would still end up being higher than the highest priced contract.
There are a couple of ways to play the anticipated move up move in corn.
Corn Futures
Pros: The most efficient way to play a corn rally is via a futures account because you can custom pick which month you want the contract to expire. Since you don’t precisely know how long this rally will last, one idea might be to diversify a bit and buy a number of different contracts. This will also make it easier to trade in the more illiquid contracts. The following contracts match up the closest to the expected length of the rallies per the earlier table:
March 2014
December 2014
May 2015 (2 x)
September 2015
December 2015
Cons: You have to have a futures account or open up a futures account. The volume for the 2015 contracts is quite low for institutional investors.
CORN ETF
Pros: You don’t have to have or open up a futures account to buy (ticker symbol) CORN. It is more liquid than the 2015 corn contracts. From its June 9, 2010 inception to August 30, 2011, CORN doubled. If history repeats, such outsized returns are not out of the question at all.
Cons: The volume is still only about $1.6 million a day which is still quite low for the institutional investor. But the bigger problem is the future expected contango. Right now, the CORN ETF manager is allocating incoming money by spending 35% on the March 2014 contract, 30% on May 2014 and 35% on December 2014. So if the 2015 prices go up faster than 2014 prices, the ETF manager will have to pay up for the contango when he flips to 2015. Therefore, you will miss out on that part of the move. If you already owned the 2015 contracts the contango differential increase goes right in your pocket as profit. Of course corn can spike for 2014 and then go down in 2015. There is no inherent free lunch either way. It is just that with the futures account you have more options to customize the buying of exactly the kind of contract which matches up with your theory on when the price will peak.
In summary, the reward/risk for buying corn is extremely high right now. Absolute Value Research subscribers will be kept informed of changes in the reward/risk ratio in corn.
Indicator: Corn ROC(314)
Inception: January 1, 1949
Frequency: Daily
November 18, 2013 percentile: 0.1%
December 8, 2013 percentile: 0.5%
James V. Debevec II is the founder of AbsoluteValueResearch.com |