Bond yields rise at the 2nd fastest pace in history. What does this mean for stocks and bonds?
by James Debevec II
December 1, 2013
In an August 17, 2012 article titled “ Indicator at Levels Only Seen Near the Epic 1932 and 2009 Stock Market Lows ”, I predicted the S&P 500 would hit 1800 by November 30, 2013. On November 30, 2013 the S&P closed at 1805. Many of the bullish stocks/bearish bonds indicators that I wrote about in 2012 are now at the opposite end of the spectrum. This article will look at one of them.
The subject of today’s article is the 1 year rate of change (252 trading days) in the 30-year bond yield. The chart below is from February 1977 (the re-introduction of the 30-year bond into the marketplace) to November 30, 2013. The top chart is the indicator, the middle chart is the 30-year bond yield and the third chart is the S&P.
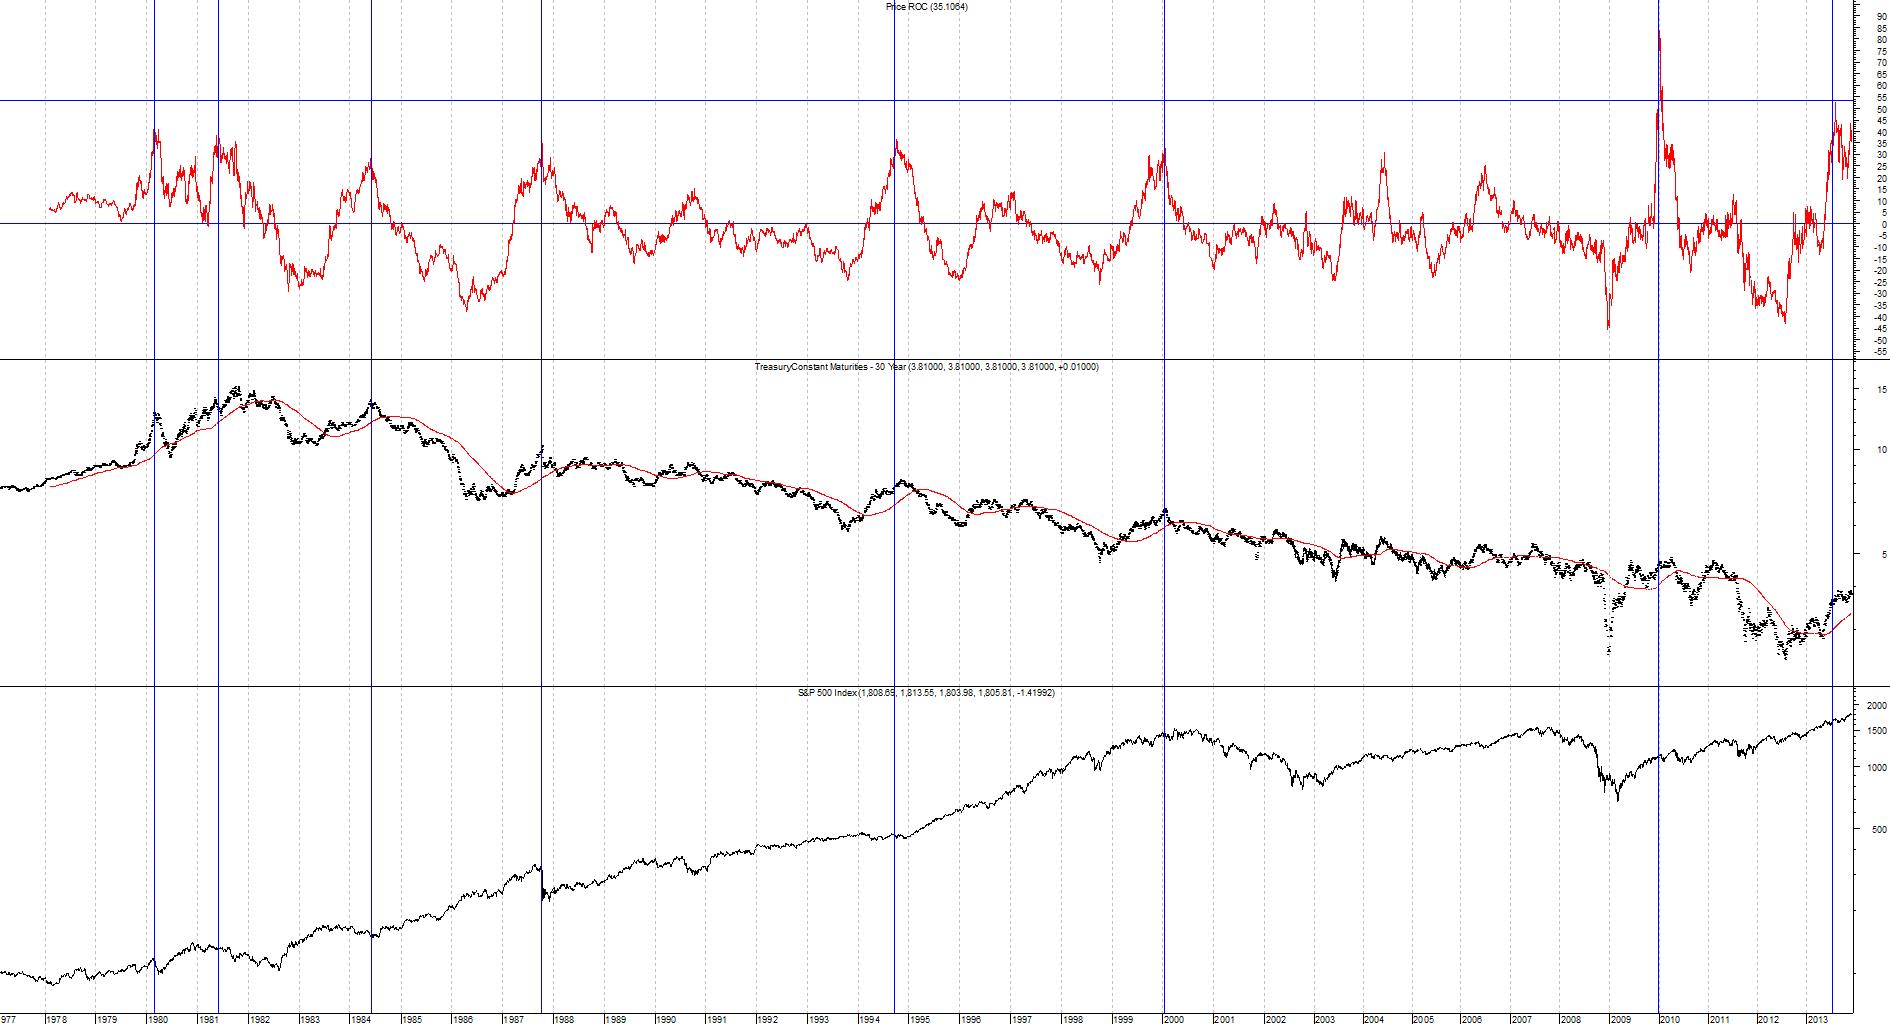
Bond Yields
This indicator has been very accurate in predicting the future direction of bond yields. As you can see on the chart above and the table below, when bond yields go up a lot quickly, they tend to go back down.
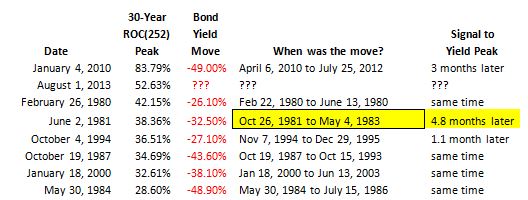
There were four times yields did not peak at the same time as the signal. There wasn’t much upside left in yields from the January 4, 2010 signal to the April 6, 2010 yield high (+4%). Nor from the October 1994 signal to the November 1994 yield peak (+3.4%). The current situation has had a +3.4% move up in 3.6 months thus far. The only time bond yields went up quite a bit from the signal (+15.81%) was during the 1981 blow off top. Here is a detailed look at major inflection points in yields back then:
June 2, 1981 13.13% Signal peak
June 16, 1981 12.59% Bottom of mild yield pullback
October 26, 1981 15.21% All-time high
May 4, 1983 10.27% Intermediate term bottom
While the indicator did not mark the exact yield peak, it was only 4.8 months from the all-time high on bond yields.
Less than 1.9 months from bond yield’s all-time low of July 25, 2012, I issued my first short bond recommendation: “ In addition to buying stocks, traders should strongly consider not only selling bonds, but shorting them as well .” The 30-year bond yield high since August 3, 2011 was on November 20, 2013. This indicator would suggest now is a good time to cover bond shorts.
Stocks
When interest rates go up quickly, stocks often run into problems.
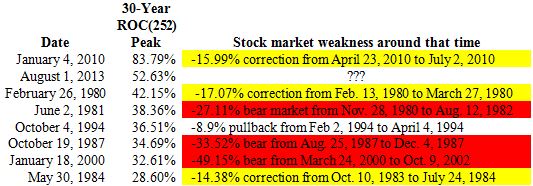
The only time rapidly rising bond yields didn’t produce at least a 14% correction was 1994. While an 8.9% drawdown isn’t too intimidating, at the December 8, 1994 double bottom, stocks were only 1.4% above the April 4, 1994 low. So basically stocks went nowhere for 10 months. While it looks like we are nearing a good short setup, there is one (trillion dollar) problem. That would be Quantitative Easing.
What to do?
The first step is to cover your bond shorts. As for stocks, there are other assets which have indicators giving off buy signals just like equities did 16 months ago. These assets have a more favorable reward/risk profile than stocks do now.
Indicator: 30-Year Bond Yield ROC(252)
Inception: February 15, 1977
Frequency: Daily
August 1, 2013 Percentile: 99.8%
November 29, 2013 Percentile: 98.5%
James Debevec II is the founder of AbsoluteValueResearch.com |