Three More Commodity Indicators at Extremes
February 9, 2014
Absolute Value Research has analyzed bullish indicators for corn, coffee, copper, heating oil, silver and wheat. This article will present three more indicators which suggest commodities are in the beginning phase of a bull market.
Inflation sub 2% in 19 of the last 20 months
In the last research report of 2013, Absolute Value Research noted that inflation was 0.96% in October. That was in the 1.9% percentile of readings since February 1, 1962. Not only was the inflation rate very low in October, but it has been low for 20 months.
The Federal Reserve’s target rate of inflation is 2%. The inflation rate has been below 2% for 19 out of the last 20 months. Since January 1966, the previous record for most sub 2% inflation months out of 20 was 18 on June 1999. Since 1966, the only times the inflation rate was below 2% for more than 14 out of 20 months were in 1999 and 2013. In other words, over the last 48 years, the only two periods of sustained low inflation were November 1997-June 1999 and May 2012-December 2013.
In the few years leading up to June 1999, commodities went down and stocks went up.
In the few years leading up to Dec. 2013, commodities went down and stocks went up.
What happened after June 1999?
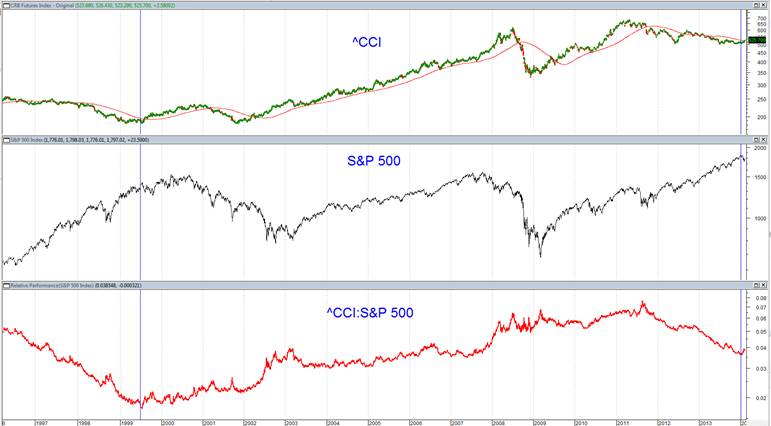
The ^CCI is a Commodity Index.
Stocks had a 12.08% correction from July 16-October 15, 1999.
Commodities had a 28% bull market from July 13, 1999 –October 12, 2000.
The all-time low in the ratio between commodities and stocks was on July 16, 1999.
The inflation rate went from 1.96% in June 1999 to 3.76% in March 2000. March 2000 was the peak of the great stock bull market.
$CCI ADX(21)
The ADX is a quantitative indicator which measures the strength of an investment vehicle’s trend, irrespective of its direction. The 21 represents how many trading days the indicator covers. Twenty one trading days is about one calendar month. Rather than spending a lot of time explaining how to calculate the ADX, let the computer do the dirty work. That way we can focus our time finding a way to make money off of the indicator.

The top chart in the above graphic is the Continuous Commodity Index ($CCI). The bottom chart is the ADX(21) of the $CCI. Conveniently, a horizontal line has been placed near the low ADX readings of 2013/2014. If you carefully follow the line all the way across, you will discover the only time the ADX was lower than the 2013/ 2014 lows was in mid-2007. The six lowest readings in history were May 23-31, 2007. The seventh lowest reading in history for this indicator was on October 25, 2013. That means the October 25, 2013 reading was at the 0.1% percentile.
Here are the readings of the five lowest yearly readings of the $CCI ADX(21)
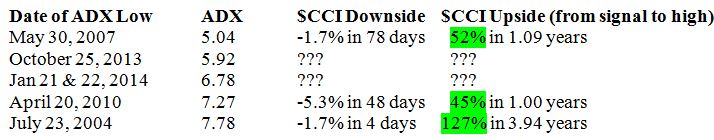
As you can see, the $CCI ADX(21) is a reliable indicator. When commodities have gone nowhere for a month, the next move has been up by a minimum of 45% for at least a year. Add the $CCI ADX(21) to the burgeoning collection of bullish commodity indicators.
$CCI –DI(332)
The final indicator we will look at is the Negative Direction Indicator (-DI). What is the Negative Direction Indicator? Investorwords.com defines it as “a technical analysis tool indicating that a trend is declining”.
In order to properly compute the Negative Direction Indicator, one needs daily highs and lows. The intraday data for the $CCI starts on June 11, 1986.
On September 13, 2012, the Federal Reserve announced their third incarnation of money printing called Quantitative Easing III. In a move which was counterintuitive to those who trade on “The News”, the summer 2012 commodities bear market rally peaked the very next day.
The $CCI low for the recent commodity bear market was 500.38 on June 28, 2013. Rally attempts off of this low have been feeble as you can see on the charts. As recently as January 9, the $CCI closed at 503.9. There were 332 trading days from the September 14, 2012 bear market rally high to January 9, 2014 . So while the $CCI intraday data starts on June 11, 1986, the –DI( 332) could not be properly calculated until September 22, 1987.
On January 9, 2014 the $CCI –DI (332) reached an all-time high of 34.74.
From the indicator’s September 22, 1987 inception to September 2013, the $CCI -DI high was 32.28 on December 5, 2008.
What happened after December 5, 2008? December 5, 2008 was the exact day of the low of the Great Commodity Bear Market of 2008. Commodities went up 108% to their all-time high on April 25, 2011. From December 5, 2008 to August 22, 2011, commodities outperformed stocks by 54.75%.
If history repeats, the economic cycle has entered the phase when commodities outperform stocks. In a future report, Absolute Value Research will reveal what statistics say is the best ETF to buy for maximizing gains from this commodity bull.
|