Indicator signal has led to precious metal stocks tripling every time over the last 70 years
January 26, 2014
Over the last few years gold stocks have significantly underperformed gold. This week we will take a look at what has happened in the past after gold stocks significantly underperformed gold.
^BGMI:Gold
The oldest precious metals index is the Barron’s Gold Mining Index (^BGMI). It is a weekly index and goes back to December 23, 1938. On June 20, 2013, the ratio between the ^BGMI and gold hit its lowest level since 1942. In fact, 1942 was the only year the ratio got as low as it did in 2013.
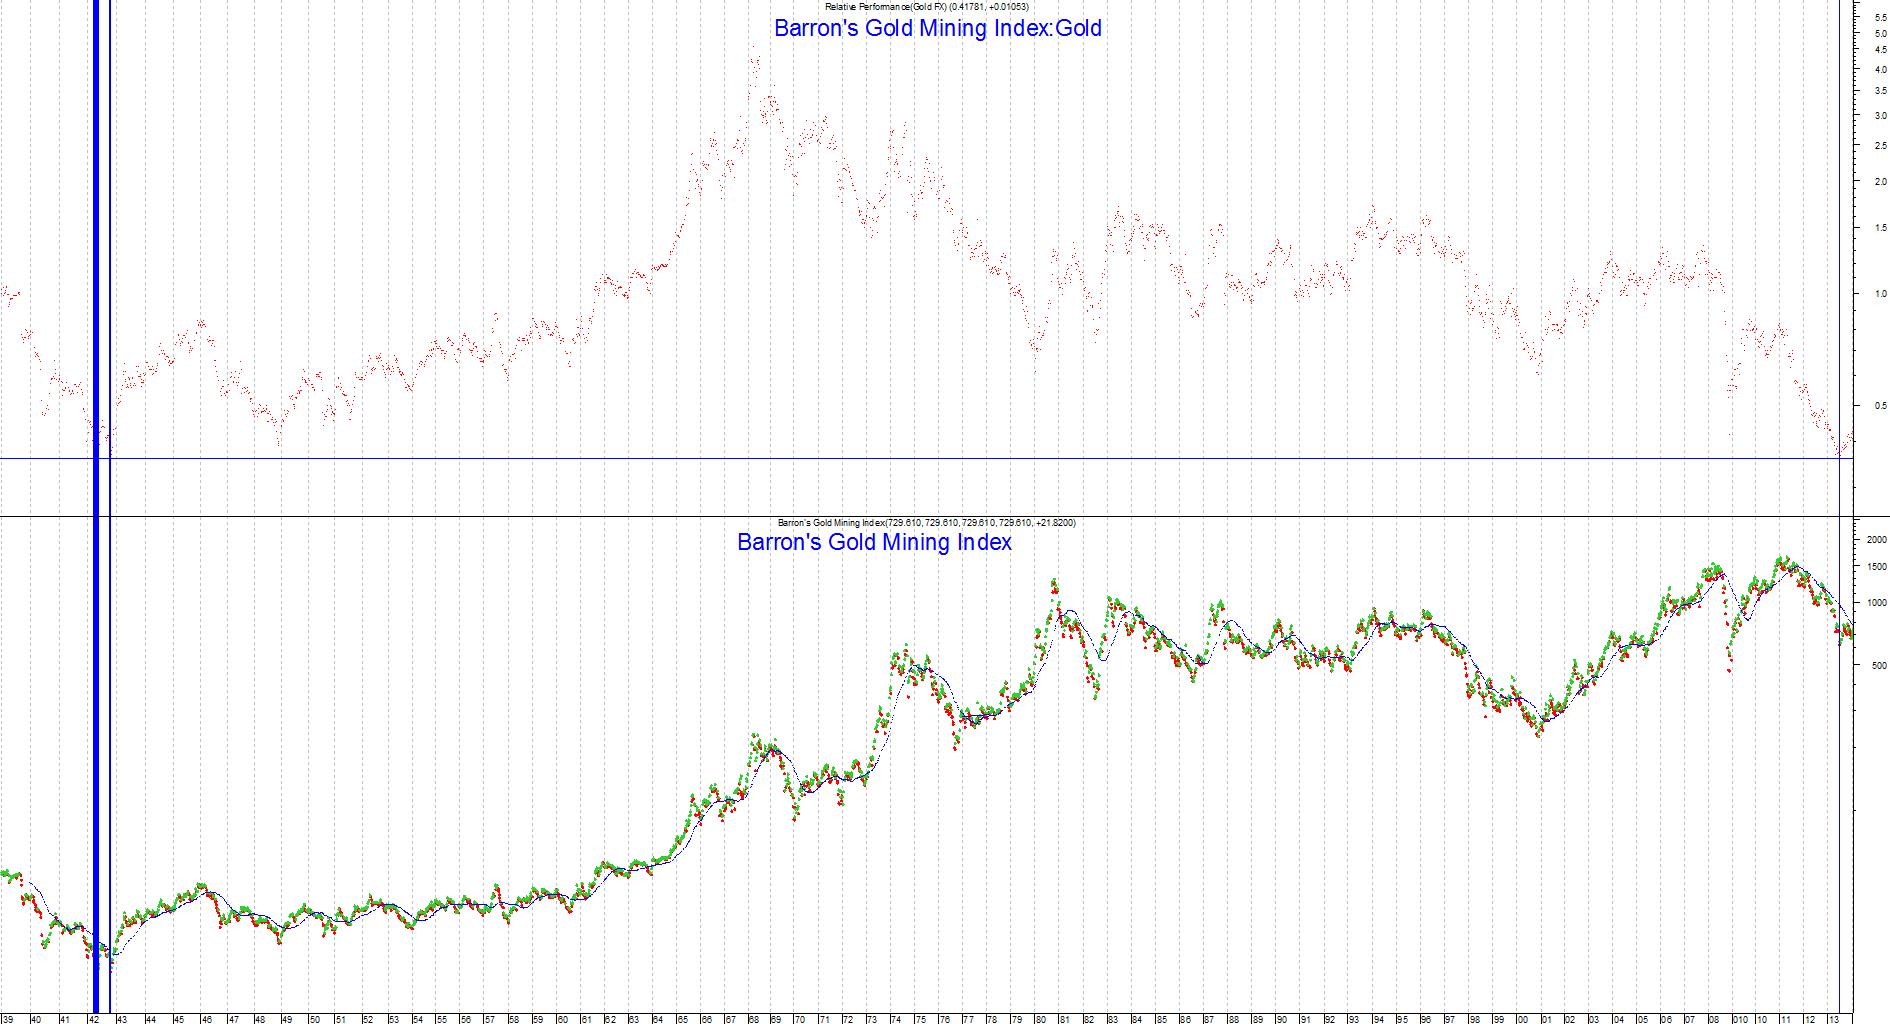
In 1942, gold stocks bottomed, rallied 33%, and then successfully retested the low 24 weeks after the first bottom.
In 2013, gold stocks bottomed, rallied 27%, and then successfully retested the low 23 weeks after the first bottom.
As you can see in the chart, 1942 was the year of the all-time low in the Barron’s Gold Mining Index.
^BGMI:Gold ROC (195)
On June 20, 2013 the 195 week Rate of Change (ROC) of the ratio between the Barron’s Gold Mining Index and gold hit -57.43%. That was a level which has been reached for only 39 weeks since 1938. A lot of those weeks were right next to each other. For example, from September 18, 1942 to December 4, 1942 this indicator was below -57.43% for 12 weeks in a row. To avoid being redundant, we will only look at the instances when there was no signal for the previous three weeks. This narrows the number of instances from 39 to eight.
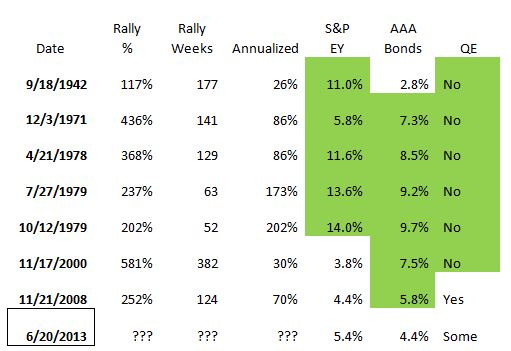
So what happened next? The following table lists the first week the indicator reached -57.43% in each of the seven previous “groups”:
09/18/1942 Gold stocks went up 117% over the next 177 weeks which is 26% annualized.
12/03/1971 Gold stocks went up 436% over the next 141 weeks which is 86% annualized.
04/21/1978 Gold stocks went up 368% over the next 129 weeks which is 86% annualized.
07/27/1979 Gold stocks went up 237% over the next 63 weeks which is 173% annualized.
10/12/1979 Gold stocks went up 202% over the next 52 weeks which is 202% annualized.
11/17/2000 Gold stocks went up 581% over the next 382 weeks which is 30% annualized.
11/21/2008 Gold stocks went up 252% over the next 124 weeks which is 70% annualized.
06/20/2013 ???
None of the rallies listed above were bear market rallies. While some of the precious metal indices have hit new lows since June, the ^BGMI has not. The ^BGMI has a larger silver and copper component than gold “pure play” indices such as ^HUI. Silver and copper have held their June lows much better than the gold complex. Therefore, in order to replicate the ^BGMI, one must have a fair amount of silver and copper stocks in their portfolio. Absolute Value Research has written bullish reports about copper in December and silver last week.
As for gold vs. gold stocks:
09/18/1942 Gold stocks outperformed gold by 104% over the next 177 weeks.
12/03/1971 Gold stocks outperformed gold by 57% over the next 110 weeks.
04/21/1978 Gold stocks outperformed gold by 16% over the next 131 weeks.
07/27/1979 Gold stocks outperformed gold by 51% over the next 64 weeks.
10/12/1979 Gold stocks outperformed gold by 77% over the next 53 weeks.
11/17/2000 Gold stocks outperformed gold by 121% over the next 360 weeks.
11/21/2008 Gold stocks outperformed gold by 103% over the next 43 weeks.
06/20/2013 ???
Many columnists are instructing readers to stay away from gold because it has no yield and stocks and bonds do. One can only speculate as to when they discovered this. Other soothsayers are issuing dire warnings of a precious metals collapse because the Fed is tapering its Quantitative Easing program.
In five of the seven prior instances, gold stocks rallied despite the S&P 500 earnings yield being higher than it was at the recent signal.
In six of the seven prior instances, gold stocks rallied despite AAA Long Term Corporate bond yields being higher than it was at the recent signal.
In six of the seven prior instances, gold stocks rallied despite there being no Quantitative Easing at the time. Additionally Quantitative Easing is still scheduled to continue (albeit in slowly diminished form) for the rest of 2014.
If history repeats gold stocks should reach all-time highs.
Indicator: ^BGMI:Gold
Inception of Data: December 23, 1938
Frequency: Weekly
Percentile (June 20, 2013): 0.2%
Percentile (January 23, 2014): 1.6%
Indicator: ^BGMI:Gold ROC (195)
Inception of Data: December 23, 1938
Frequency: Weekly
Percentile (June 20, 2013): 1.0%
Percentile (January 23, 2014): 8.0%
|