The Yen
January 12, 2014
In December, Absolute Value Research examined indicators which covered stocks, bonds and commodities. Conspicuously absent has been an article about currencies. Conveniently, there is a Yen indicator which reached the 99.9% percentile in late December. It seems like as good a time as any for our first currency report. Today we will look at the relationship between the Japanese Yen and the United States Dollar.
The Quotes
The relationship between the Yen and the United States currency can be presented in a number of different ways:
As of this writing:
1 Japanese Yen = 0.009615 United States Dollar (higher # means more valuable Yen)
1 United States Dollar = 104.0042 Japanese Yen (higher # means more valuable Dollar)
1 Japanese Yen = 0.9615 United States Penny (higher # means more valuable Yen)
1 United States Penny = 1.040042 Japanese Yen (higher # means more valuable Penny)
An example of the JPY/USD (1 JPY = X USD) quote can be found on the CME webpage. This quote’s main strengths are: 1) it is in dollars which is the main monetary unit in the United States; 2) other currencies are listed in dollars which makes comparisons easier and 3) it is intuitive in the sense that that when the 0.009615 number increases, it means the Yen is getting stronger.
The USD/JPY (1 USD = X JPY) is the industry standard notation for the Yen. When an article is about the counter currency (the 1 st currency listed is the base and the second is the counter) it can make for some unintuitive reading. Here is a recent article about the Yen which uses the USD/JPY quote. “Japan’s currency may gain toward 86.84, a level known as the 61.8 percent Fibonacci retracement of its drop from a post-war high of 75.35 per dollar in October 2011 to its five-year low of 105.44 on Jan. 2.” To make matters even more confusing, industry parlance has some currency pairs with USD being the “counter” (EUR/USD, GBP/USD, AUD/USD and NZD/USD) and some with USD being the “base” (USD/CAD, USD/CHF and USD/JPY).
A good example of the 1 JPY = X US Penny quote is at finviz.com. If you are in a situation where there are only four decimal places to work with, for 0.009615, the extra “9615” contains more information than the “0096”. However, what can make this confusing is all the other foreign currency quotes on the Finviz page are listed in dollars. It is not readily apparent that the Yen quote is different from all the other foreign currency exchange rate quotes.
You can see currency quotes are ripe with potential sources of misunderstanding. The Yen’s all-time low is 0.2765 penny (1968) and its post 1948 high is 1.321 penny (October 28, 2011). If you remember the Yen is worth close to a penny you should be able to figure out if the quote deals with dollars or pennies.
The Indicator
On December 24, 2013, in the Commitment of Traders Report, the Japanese Yen Commercials were net long 185,186 contracts. This was the second highest net long position out of 1,267 weeks. That equates to the 99.9% percentile. The record is 186,459 on June 26, 2007. For a more in depth explanation on the Commitment of Trader’s Report, see Absolute Value Research missives on December 22, 2013 (copper) and January 5, 2013 (heating oil).
The following charts are from the Commitment of Traders Report’s January 15, 1986 inception to the very present day.
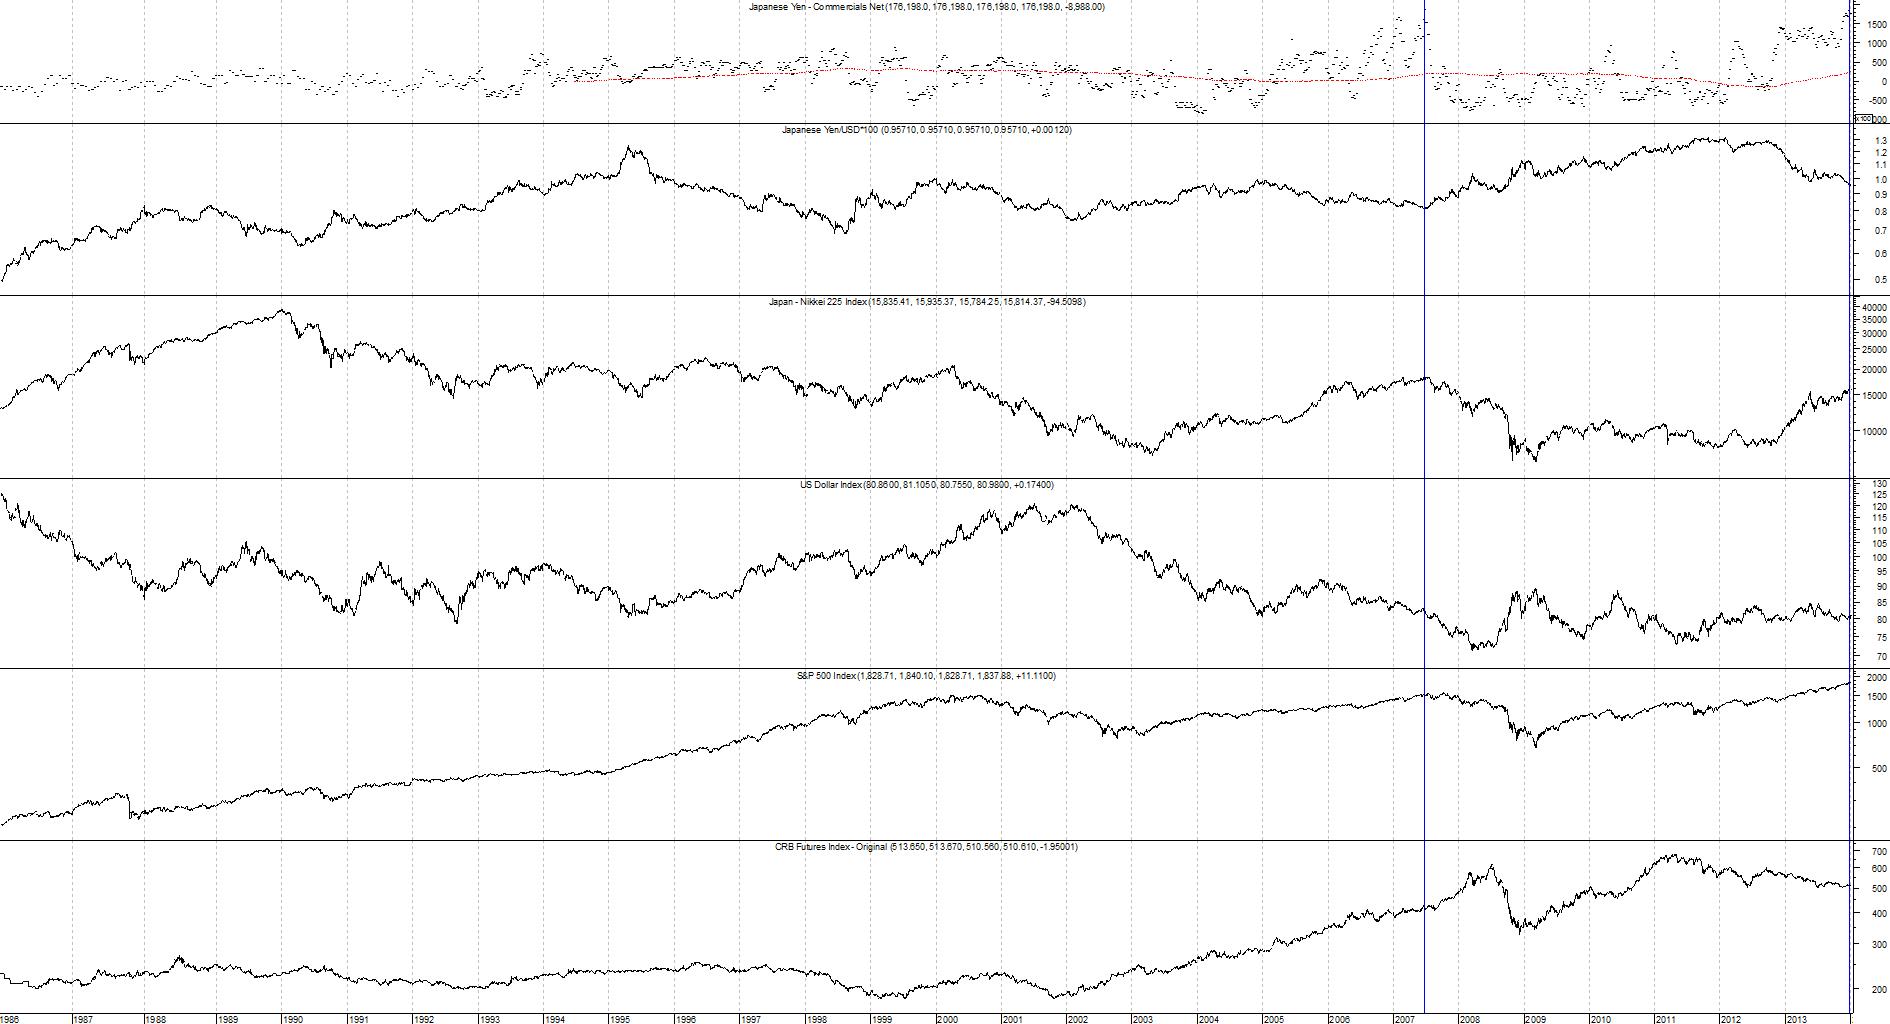
The charts in this picture are as follows (in order from top to bottom):
Chart 1 Commitment of Traders Report Japanese Yen Commercials Net Position
Chart 2 The Japanese Yen = X United States Penny (higher # means more valuable Yen)
Chart 3 The Nikkei (Japanese stock market)
Chart 4 The US Dollar
Chart 5 The S&P 500 (The US Stock Market)
Chart 6 The Continuous Commodity Index
Chart 1 Commitment of Trader’s Report Japanese Yen Commercials Net Position
There are vertical blue lines drawn at the top two readings of June 26, 2007 and December 24, 2013. June 26, 2007 seemed to be near a major inflection in many assets. Let’s see what happened next with the other charts.
Chart 2 The Yen
Note how in mid-2007 the Yen had been going down in the previous couple of years. Just like now. The Yen bottomed on June 22, 2007. Four days later the commercials were the most bullish on the Yen in history. The commercials did a spectacular job at catching the inflection point as you can see by the chart. From June 26, 2007 to Oct 28, 2011 the Yen went up 60%.
However, the futures market is also expecting the Yen to increase over the coming years. The furthest out contract is December 2018 and it is 9.9% above the March 2014 price. The COT indicator suggests the rally should greatly exceed 9.9%. Thus investing in the yen via the futures market offers an opportunity for a profit.
Chart 3 The Nikkei
By mid-2007 the Nikkei had been going up for the previous few years. Just like now. The commercials went maximum bullish on the Yen on June 26, 2007 and the Nikkei peaked 13 days later. From the signal date of June 26, 2007 to March 10, 2009 the Nikkei decreased by 60%.
Chart 4 The United States Dollar
From June 26, 2007 to March 18, 2008 the Dollar decreased by 12%.
Chart 5 The S&P 500
The United States stock market only had 4.8% of upside left from the June 26, 2007 COT signal to its October 11, 2007 high. From the June 26, 2007 COT signal to the March 9, 2009 bottom, U.S. stocks decreased by 54.6%. This is interesting as this is the third indicator (rising interest rates and low inflation) Absolute Value Research has covered which is bearish on stocks. However, the Federal Reserve is printing $75 billion a month which is bullish for the stock market. One strategy to deal with these conflicting forces might be to allocate new money elsewhere.
Chart 6 The Continuous Commodity Index
Commodities went up over 50% from the June 26, 2007 signal to their July 2, 2008 high. This is interesting as Absolute Value Research has covered quite a few indicators which have also been very constructive on commodities. As mentioned in past reports, commodities look like a better bet than stocks at this point.
| Asset |
Move |
| The Yen |
60% |
| The Nikkei |
-60% |
| USD |
-12% |
| S&P |
-54% |
| ^CCI |
50% |
In summary, a Yen is roughly equivalent to a penny. When the commercials became this bullish on the yen in the past, the Yen, Nikkei, S&P and commodities all soon saw at least a 50% move. One can argue that it isn’t wise to project too much from a sample size of one. However, it is interesting that a currency indicator is telling the same tale as the commodity indicators Absolute Value Research examined in December and January. If history repeats we may be nearing a major inflection point in various asset classes. This indicator suggests the Yen is a buy here.
Indicator: COT Japanese Yen Commercials Net Position
Inception: January 15, 1986
Frequency: Two times a month through Sep. 30, 1992, then 1x a week
Indicator Percentile (Nov.12, 2014) 99.9%
Indicator Percentile (Jan.7, 2014) 99.5%
|