What asset class performs the best after the inflation rate gets down to 0.96%?
December 29, 2013
For the 12 months ending October 31, the inflation rate was 0.96%. Since February 1, 1962, the inflation rate has been 0.96% or lower for only 13 months. That is the 1.9% percentile. This article will take a look at the four major asset classes to see which has performed best after the inflation rate got down to this level.
These 13 months of 0.96% or less inflation since February 1, 1962 are:
March 2002
December 2008-October 2009
October 2013
To avoid being repetitive, this article will refer to only post February 1, 1962. Prior to February 1962 the inflation rate got a lot lower. In 1971, Nixon removed the United States from the last vestige of the gold standard. This has produced an upward bias in the inflation rate.
From 1665 to 1932, the inflation rate was 0.16% (gold standard era)
From 1932 to 1970, the inflation rate was 2.79% (gold standard for foreign countries who traded with the US)
From 1970 to 2012, the inflation rate was 4.26% (paper standard era)
We will focus on the first month of the December 2008-October 2009 period since we don’t know how low the inflation rate will go. The inflation rate jumped from 0.96% in October to the current 1.24% reading of November (December data gets released on January 16).
Now let’s look at how stocks, fixed income, real estate and commodities fared on the months after the aforementioned dates.
Stocks
March 30, 2002 to Oct 10, 2002 The S&P dropped 33%
December 31, 2008 to March 9, 2009 The S&P dropped 27%
Fixed Income
March 31, 2002 to March 12, 2003 30-Year Treasury Bond Price up 19.1%
Dec. 31, 2008 to June 10, 2009 30-Year Treasury Bond Price down 15.5%
Low inflation hasn’t been a great predictor of future bond returns.
Real Estate
March 31, 2002 Real Estate Bull had over four years left
December 31, 2008 Real Estate Bear had over three years left.
Once again, flip a coin.
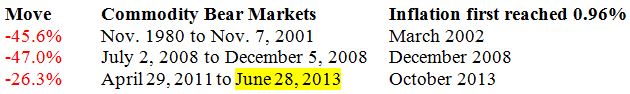
Commodities
March 31, 2002 to July 2, 2008 Commodities up 201%
December 31, 2008 to April 25, 2011 Commodities up 85%
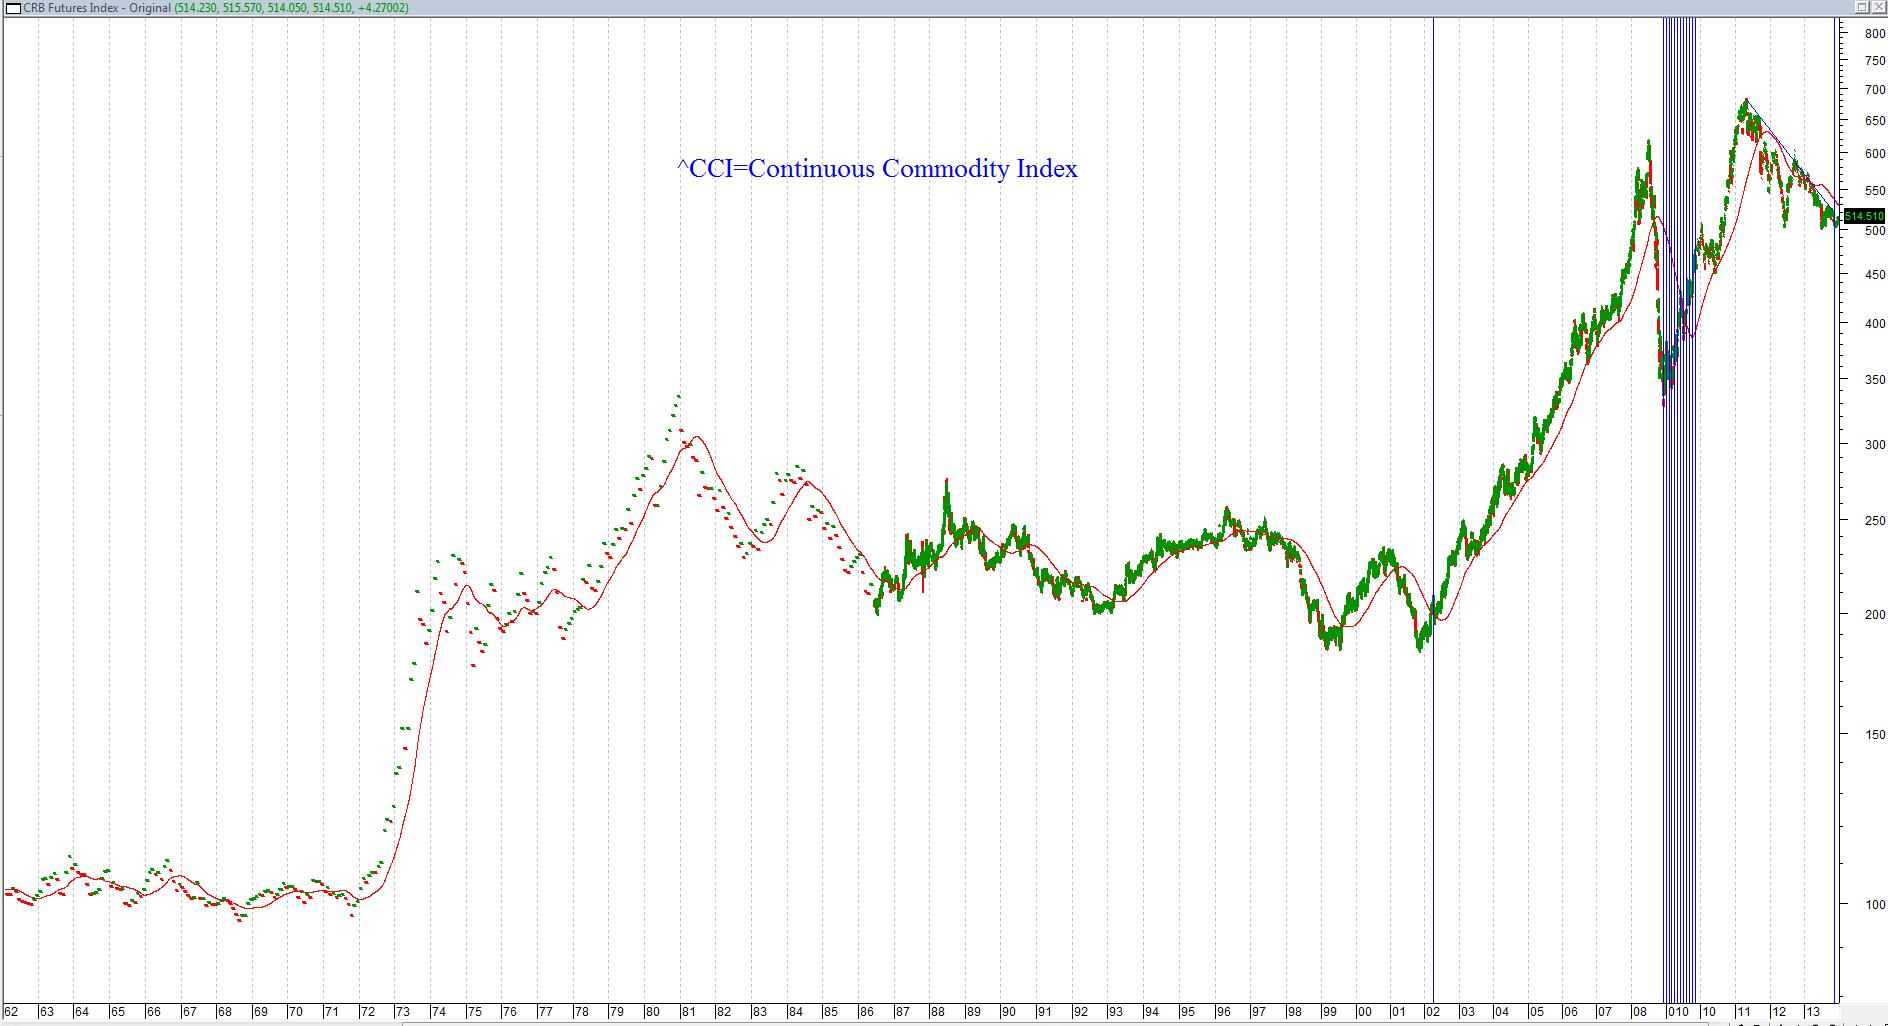
The maximum drawdowns in commodities once inflation got this low were:
March 31, 2002 to April 12, 2002 commodities decreased by 5.0%.
December 31, 2008 to March 2, 2009, commodities decreased by 6.7%.
Low inflation periods occurred near the end of commodity bear markets. This is not surprising since commodities are a component of inflation.
Conclusion
Since Nixon took the United States off the gold standard, periods of low inflation have always been followed by periods of higher inflation. The 0.91% inflation rate of March 2002 was followed by a 5.6% inflation rate in July 2008. The -2.1% inflation rate of July 2009 was followed by a 3.87% inflation rate in September 2011. Over the last half century, commodities have offered a high reward/risk ratio after periods of low inflation. If history repeats, those who increase their allocations to this beleaguered asset class are likely to be well rewarded for their contrarian play.
Indicator: Inflation
Inception May 1, 1860
Frequency: Monthly
October 31, 2013 percentile 33.1%
November 30, 2013 percentile 37.5%
Indicator Inflation
Starting Date (not inception) February 1, 1962
Frequency Monthly
October 31, 2013 percentile 1.9%
November 30, 2013 percentile 6.2%
|